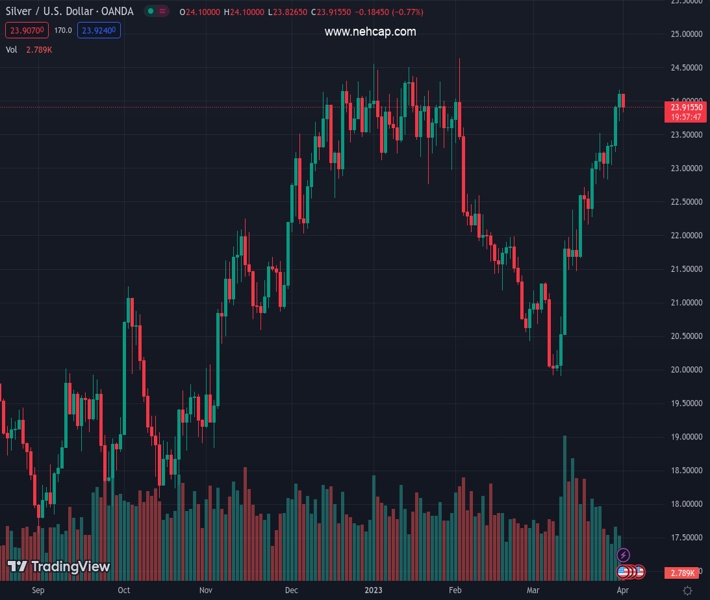
#XAGUSD @ 23.934 Silver price takes a U-turn from a one-year-old descending resistance line, reverses from two-month high., @nehcap view: Limited downside expected (Pivot Orderbook analysis)
…
This is a premium post.
[s2If !current_user_can(access_s2member_level4)]Please register for PREMIUM VERSION HERE to read full post below containing analysis. In case of any error or you think you are not able to read the full post below, please email us at support#nehcap.com [lwa][/s2If] [s2If current_user_can(access_s2member_level4)]
- Silver price takes a U-turn from a one-year-old descending resistance line, reverses from two-month high.
- Overbought RSI (14) suggest the XAG/USD’s further downside but bullish MACD signals, 12-day-old support line challenge bears.
- Silver buyers need validation from February’s high to retake control.
The pair currently trades last at 23.934.
The previous day high was 24.16 while the previous day low was 23.7. The daily 38.2% Fib levels comes at 23.98, expected to provide resistance. Similarly, the daily 61.8% fib level is at 23.87, expected to provide support.
Silver price (XAG/USD) drops to $23.90 as it snaps a three-week uptrend during early Monday. In doing so, the bright metal reverses from a downward-sloping resistance line from April 2022. Adding strength to the XAG/USD pullback is the overbought RSI (14) line.
However, the bullish MACD signals and a two-week-old ascending support line, close to $23.50 by the press time, restrict the short-term downside of the Silver price.
Following that, the 61.8% Fibonacci retracement level of the metal’s April-September 2022 downturn, near $22.90, could lure the XAG/USD bears.
It’s worth noting, though, that a convergence of the 21-DMA and 50-DMA, around $22.20 by the press time, appears a tough nut to crack for the Silver bears.
In a case where the Silver price remains weak past $22.20, the 22.00 and 50% Fibonacci retracement level around $21.90 act as the last defenses of the XAG/USD buyers.
Meanwhile, an upside clearance of the one-year-long resistance line, close to $24.05 at the latest, isn’t an open invitation to the Silver buyers as February 2023 tops surrounding $24.65 challenges the XAG/USD bulls before directing them to the April 2022 high of near $26.25.
Should the Silver price remains firmer past $26.25, the previous yearly high surrounding $27.300 will be in focus.
Trend: Limited downside expected
Technical Levels: Supports and Resistances
XAGUSD currently trading at 23.9 at the time of writing. Pair opened at 24.08 and is trading with a change of -0.75% % .
| Overview | Overview.1 | |
|---|---|---|
| 0 | Today last price | 23.9 |
| 1 | Today Daily Change | -0.18 |
| 2 | Today Daily Change % | -0.75% |
| 3 | Today daily open | 24.08 |
The pair remains strongly bullish on the daily timeframe. It trades above its 20 SMA @ 22.17, 50 SMA 22.21, 100 SMA @ 22.59 and 200 SMA @ 21.03.
| Trends | Trends.1 | |
|---|---|---|
| 0 | Daily SMA20 | 22.17 |
| 1 | Daily SMA50 | 22.21 |
| 2 | Daily SMA100 | 22.59 |
| 3 | Daily SMA200 | 21.03 |
The previous day high was 24.16 while the previous day low was 23.7. The daily 38.2% Fib levels comes at 23.98, expected to provide resistance. Similarly, the daily 61.8% fib level is at 23.87, expected to provide support.
Note the levels of interest below:
- Pivot support is noted at 23.8, 23.51, 23.33
- Pivot resistance is noted at 24.27, 24.45, 24.73
| Levels | Levels.1 |
|---|---|
| Previous Daily High | 24.16 |
| Previous Daily Low | 23.70 |
| Previous Weekly High | 24.16 |
| Previous Weekly Low | 22.83 |
| Previous Monthly High | 24.16 |
| Previous Monthly Low | 19.90 |
| Daily Fibonacci 38.2% | 23.98 |
| Daily Fibonacci 61.8% | 23.87 |
| Daily Pivot Point S1 | 23.80 |
| Daily Pivot Point S2 | 23.51 |
| Daily Pivot Point S3 | 23.33 |
| Daily Pivot Point R1 | 24.27 |
| Daily Pivot Point R2 | 24.45 |
| Daily Pivot Point R3 | 24.73 |
[/s2If]
Join Our Telegram Group
")


