WTI crude oil retreats from nine-week high as energy markets stabilize after week-start jump. (Pivot Orderbook analysis)
…
This is a premium post.
[s2If !current_user_can(access_s2member_level4)]Please register for PREMIUM VERSION HERE to read full post below containing analysis. In case of any error or you think you are not able to read the full post below, please email us at support#nehcap.com [lwa][/s2If] [s2If current_user_can(access_s2member_level4)]
- WTI crude oil retreats from nine-week high as energy markets stabilize after week-start jump.
- OPEC+ shocks Oil traders with a surprise output,
- US National Security Council criticizes the move.
- Downbeat Fed bets, mixed US data also challenge Oil price to pare the biggest daily gains in a year.
- US PMIs, jobs report will be crucial for clear directions.
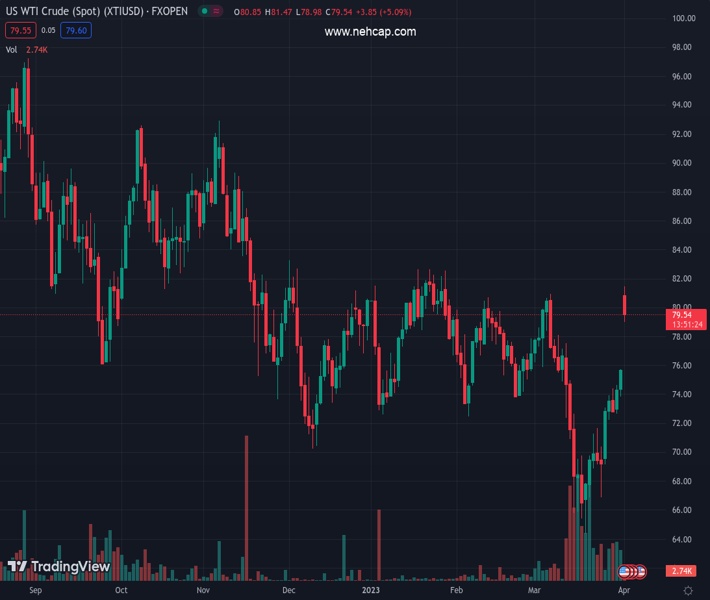
The pair currently trades last at 79.34.
The previous day high was 75.78 while the previous day low was 73.83. The daily 38.2% Fib levels comes at 75.04, expected to provide support. Similarly, the daily 61.8% fib level is at 74.58, expected to provide support.
WTI crude oil buyers take a breather, following the biggest jump since March 2022, as traders reassess the OPEC+ led moves ahead of the key US PMIs and jobs report during early Monday. With this, the black gold prints nearly 4.85% intraday gains around $79.40 by the press time.
It’s worth noting that downbeat prints of manufacturing numbers from China and Japan join the recently firmer US Dollar to challenge the WTI crude oil buyers. On the same line could be US President Joe Biden’s readiness for further release of Oil from the Strategic Petroleum Reserve (SPR) to tame the energy price run-up.
That said, the Organization of the Petroleum Exporting Countries (OPEC) and its allies led by Russia, known as OPEC+, announced a 1.16 million barrels per day of an output cut. The same renews inflation fears and allows the yields to pare recent losses.
On the same line could be the downbeat China Caixin Manufacturing PMI and Japan’s Tankan Large Manufacturing Index for the first quarter (Q1) of 2023, a closely observed output guide by the Bank of Japan (BoJ), which eased to 1.0 from 7.0 previous readings and 3.0 expected.
It should be observed that the fears of warmer weather in the West and fears of some more rate hikes from the top-tier central banks before they welcome the doves seem to also exert downside pressure on the WTI crude oil prices.
Looking forward, multiple top-tier central bank events and inflation numbers are up for publishing and can join Friday’s US jobs report to entertain Oil traders.
A clear upside break of the 10-week-old descending resistance line surrounding $80.00, as well as a downward-sloping trend line from early November near $78.30, become necessary for the WTI crude oil buyers to keep the reins.
Technical Levels: Supports and Resistances
XTIUSD currently trading at 79.34 at the time of writing. Pair opened at 75.76 and is trading with a change of 4.73% % .
| Overview | Overview.1 | |
|---|---|---|
| 0 | Today last price | 79.34 |
| 1 | Today Daily Change | 3.58 |
| 2 | Today Daily Change % | 4.73% |
| 3 | Today daily open | 75.76 |
The pair is trading above its 20 Daily moving average @ 72.62, above its 50 Daily moving average @ 75.77 , above its 100 Daily moving average @ 76.95 and below its 200 Daily moving average @ 83.64
| Trends | Trends.1 | |
|---|---|---|
| 0 | Daily SMA20 | 72.62 |
| 1 | Daily SMA50 | 75.77 |
| 2 | Daily SMA100 | 76.95 |
| 3 | Daily SMA200 | 83.64 |
The previous day high was 75.78 while the previous day low was 73.83. The daily 38.2% Fib levels comes at 75.04, expected to provide support. Similarly, the daily 61.8% fib level is at 74.58, expected to provide support.
Note the levels of interest below:
- Pivot support is noted at 74.47, 73.18, 72.52
- Pivot resistance is noted at 76.41, 77.07, 78.36
| Levels | Levels.1 |
|---|---|
| Previous Daily High | 75.78 |
| Previous Daily Low | 73.83 |
| Previous Weekly High | 75.78 |
| Previous Weekly Low | 69.18 |
| Previous Monthly High | 80.99 |
| Previous Monthly Low | 64.39 |
| Daily Fibonacci 38.2% | 75.04 |
| Daily Fibonacci 61.8% | 74.58 |
| Daily Pivot Point S1 | 74.47 |
| Daily Pivot Point S2 | 73.18 |
| Daily Pivot Point S3 | 72.52 |
| Daily Pivot Point R1 | 76.41 |
| Daily Pivot Point R2 | 77.07 |
| Daily Pivot Point R3 | 78.36 |
[/s2If]
Join Our Telegram Group
")


