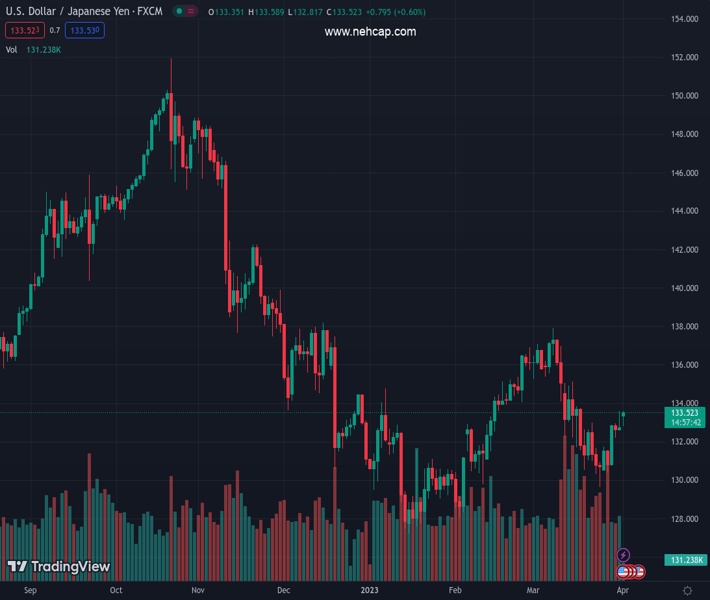
#USDJPY @ 133.498 renews intraday high near the highest levels in two weeks. (Pivot Orderbook analysis)
…
This is a premium post.
[s2If !current_user_can(access_s2member_level4)]Please register for PREMIUM VERSION HERE to read full post below containing analysis. In case of any error or you think you are not able to read the full post below, please email us at support#nehcap.com [lwa][/s2If] [s2If current_user_can(access_s2member_level4)]
- USD/JPY renews intraday high near the highest levels in two weeks.
- Yields grind higher as OPEC+ renew inflation woes; US Dollar cheers pre-NFP rebound.
- Japan’s Tankan Large Manufacturing Index eased in Q1, Jibun Bank Manufacturing PMI improved in March.
- US PMIs, ADP data can entertain traders ahead of Friday’s jobs report.
The pair currently trades last at 133.498.
The previous day high was 133.6 while the previous day low was 132.59. The daily 38.2% Fib levels comes at 133.21, expected to provide support. Similarly, the daily 61.8% fib level is at 132.97, expected to provide support.
USD/JPY takes the bids to refresh intraday high near 133.50 as bulls keep the reins after witnessing the first weekly gain in five.
The Yen pair’s latest gains could be linked to the firmer US Treasury bond yields, as well as the US Dollar, as markets await the all-important Nonfarm Payrolls (NFP), up for publishing on Friday. Adding strength to the USD/JPY pair’s run-up could be the latest challenges to the sentiment, mainly emanating from the Organization of the Petroleum Exporting Countries (OPEC) and its allies led by Russia, known as OPEC+. However, the mixed data at home and anxiety ahead of top-tier US statistics challenge the pair buyers of late.
Japan’s Tankan Large Manufacturing Index for the first quarter (Q1) of 2023, a closely observed output guide by the Bank of Japan (BoJ), eased to 1.0 from 7.0 previous readings and 3.0 expected. On the other hand, Japan’s Jibun Bank Manufacturing PMI for March improved to 49.2 from 48.6 previous. However, the below-50 figure suggests a contraction in private manufacturing activities.
On the other hand, the US Core Personal Consumption Expenditures (PCE) Price Index, the Fed’s preferred gauge of inflation, declined to 4.6% YoY in February from 4.7% expected and prior. On a monthly basis, Core PCE inflation rose 0.3% while easing below the market expectation of 0.4% and a downwardly revised 0.5% previous reading.
It’s worth observing that the receding hawkish calls surrounding the Bank of Japan (BoJ) also favor USD/JPY buyers. However, the recent easing calls of the Fed’s hawkish moves, as well as easing fears of the banking crisis, seem to gain little attention.
Against this backdrop, Japan’s Nikkei 225 rises 1.0% intraday to 28,041 by the press time but the S&P 500 Futures snapped a three-day uptrend near the highest levels since mid-February.
On the other hand, the US 10-year and two-year Treasury bond yields print mild gains near 3.52% and 4.11% while paring the latest losses. It should be noted that the benchmark US 10-year Treasury bond yields dropped for the past three weeks and the past three consecutive days.
Looking ahead, USD/JPY is likely to extend the latest rebound amid a light calendar and firmer yields. However, receding hawkish bets on the Fed may weigh on the US Dollar prices should the incoming PMIs and Nonfarm Payrolls (NFP) disappoint the greenback buyers.
An upside break of 50-DMA, close to 133.00 at the latest, joins bullish MACD signals and firmer RSI (14), not overbought to direct USD/JPY buyers towards the 100-DMA hurdle of around 133.85.
Technical Levels: Supports and Resistances
USDJPY currently trading at 133.39 at the time of writing. Pair opened at 132.87 and is trading with a change of 0.39% % .
| Overview | Overview.1 | |
|---|---|---|
| 0 | Today last price | 133.39 |
| 1 | Today Daily Change | 0.52 |
| 2 | Today Daily Change % | 0.39% |
| 3 | Today daily open | 132.87 |
The pair is trading above its 20 Daily moving average @ 133.27, above its 50 Daily moving average @ 132.95 , below its 100 Daily moving average @ 133.87 and below its 200 Daily moving average @ 137.32
| Trends | Trends.1 | |
|---|---|---|
| 0 | Daily SMA20 | 133.27 |
| 1 | Daily SMA50 | 132.95 |
| 2 | Daily SMA100 | 133.87 |
| 3 | Daily SMA200 | 137.32 |
The previous day high was 133.6 while the previous day low was 132.59. The daily 38.2% Fib levels comes at 133.21, expected to provide support. Similarly, the daily 61.8% fib level is at 132.97, expected to provide support.
Note the levels of interest below:
- Pivot support is noted at 132.44, 132.01, 131.43
- Pivot resistance is noted at 133.45, 134.03, 134.46
| Levels | Levels.1 |
|---|---|
| Previous Daily High | 133.60 |
| Previous Daily Low | 132.59 |
| Previous Weekly High | 133.60 |
| Previous Weekly Low | 130.41 |
| Previous Monthly High | 137.91 |
| Previous Monthly Low | 129.64 |
| Daily Fibonacci 38.2% | 133.21 |
| Daily Fibonacci 61.8% | 132.97 |
| Daily Pivot Point S1 | 132.44 |
| Daily Pivot Point S2 | 132.01 |
| Daily Pivot Point S3 | 131.43 |
| Daily Pivot Point R1 | 133.45 |
| Daily Pivot Point R2 | 134.03 |
| Daily Pivot Point R3 | 134.46 |
[/s2If]
Join Our Telegram Group
")


