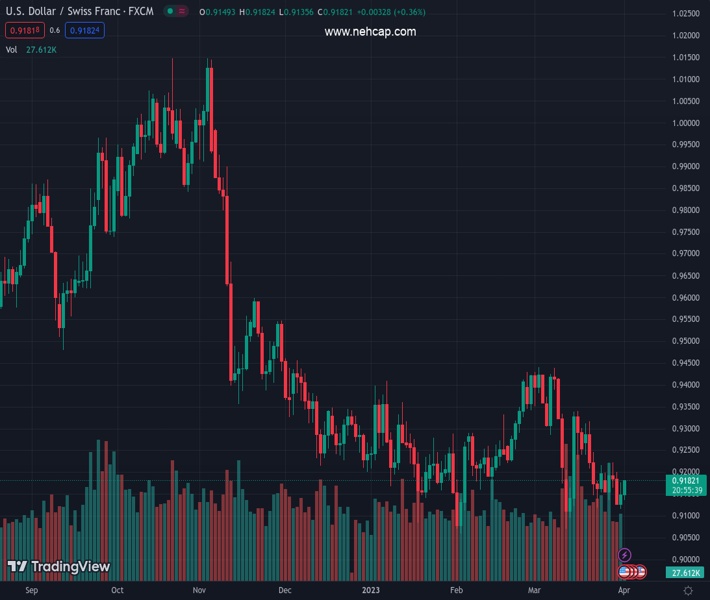
#USDCHF @ 0.91774 extends Friday’s recovery from three-week low on DXY’s rebounds. (Pivot Orderbook analysis)
…
This is a premium post.
[s2If !current_user_can(access_s2member_level4)]Please register for PREMIUM VERSION HERE to read full post below containing analysis. In case of any error or you think you are not able to read the full post below, please email us at support#nehcap.com [lwa][/s2If] [s2If current_user_can(access_s2member_level4)]
- USD/CHF extends Friday’s recovery from three-week low on DXY’s rebounds.
- Market sentiment sours on OPEC+ surprise output cut, cautious mood ahead of top tier data/events.
- Swiss CPI, US NFP will be the key, PMIs are also important to watch for clear directions.
The pair currently trades last at 0.91774.
The previous day high was 0.9178 while the previous day low was 0.9116. The daily 38.2% Fib levels comes at 0.9154, expected to provide support. Similarly, the daily 61.8% fib level is at 0.9139, expected to provide support.
USD/CHF picks up bids to renew intraday high around 0.9170 as it extends the previous day’s upside while consolidating the two-week downtrend during early Monday. In doing so, the Swiss Franc (CHF) pair justifies the market’s risk-off mood ahead of the key data/events amid fears of an additional toll on the global growth, mainly after the oil output cut from the Organization of the Petroleum Exporting Countries (OPEC) and allies led by Russia, known as OPEC+.
After multiple days of optimism, market sentiment sours during early Monday as an output cut from the global oil producers propels the odds of higher inflation and an additional burden on the economy, suggesting more chances of witnessing a recession. It’s worth noting that the cautious mood ahead of the Swiss Consumer Price Index (CPI) for March and the US Nonfarm Payrolls (NFP) for the said month also weigh on the risk appetite and fuel the USD/CHF prices.
It’s worth noting, however, that the receding hawkish bets on the Federal Reserve (Fed), especially after the previous week’s downbeat data, join the easing fears of the banking crisis to challenge the US Dollar bulls ahead of the key US jobs report.
As per the latest data, the US Core Personal Consumption Expenditures (PCE) Price Index, the Fed’s preferred gauge of inflation, for February declined to 4.6% YoY from 4.7% expected and prior. On a monthly basis, Core PCE inflation rose 0.3% while easing below the market expectation of 0.4% and a downwardly revised 0.5% previous reading. Further, the Chicago PMI reading for March came in stronger than expected at 43.8 while the final readings of the University of Michigan’s (UoM) Consumer Confidence Index dropped to 62.0 in March, versus 63.4 flash estimations and 63.2 market forecasts. Additionally, Current Economic Conditions fell from 70.7 in February to 66.3 and the Index of Consumer Expectations declined from 64.7 to 59.2.
Amid these plays, S&P 500 Futures print mild losses despite the firmer closing of Wall Street while the US Treasury bond yields pause the three-day downtrend.
Moving on, the Swiss CPI and SVME Purchasing Managers’ Index for March will precede the US ISM Manufacturing PMI for the said month to direct intraday moves of the USD/CHF pair. However, major attention should be given to the risk catalysts and Friday’s US jobs report for a clear guide.
A one-month-old descending resistance line, around 0.9180 by the press time, challenges USD/CHF bulls even if MACD and RSI suggest that the bears are running out of steam.
Technical Levels: Supports and Resistances
USDCHF currently trading at 0.917 at the time of writing. Pair opened at 0.915 and is trading with a change of 0.22% % .
| Overview | Overview.1 | |
|---|---|---|
| 0 | Today last price | 0.917 |
| 1 | Today Daily Change | 0.0020 |
| 2 | Today Daily Change % | 0.22% |
| 3 | Today daily open | 0.915 |
The pair remains strongly bearish on the daily time frame. It trades below the 20 SMA @ 0.9236, 50 SMA 0.925, 100 SMA @ 0.9297 and 200 SMA @ 0.9519.
| Trends | Trends.1 | |
|---|---|---|
| 0 | Daily SMA20 | 0.9236 |
| 1 | Daily SMA50 | 0.9250 |
| 2 | Daily SMA100 | 0.9297 |
| 3 | Daily SMA200 | 0.9519 |
The previous day high was 0.9178 while the previous day low was 0.9116. The daily 38.2% Fib levels comes at 0.9154, expected to provide support. Similarly, the daily 61.8% fib level is at 0.9139, expected to provide support.
Note the levels of interest below:
- Pivot support is noted at 0.9118, 0.9086, 0.9056
- Pivot resistance is noted at 0.918, 0.921, 0.9242
| Levels | Levels.1 |
|---|---|
| Previous Daily High | 0.9178 |
| Previous Daily Low | 0.9116 |
| Previous Weekly High | 0.9224 |
| Previous Weekly Low | 0.9116 |
| Previous Monthly High | 0.9440 |
| Previous Monthly Low | 0.9072 |
| Daily Fibonacci 38.2% | 0.9154 |
| Daily Fibonacci 61.8% | 0.9139 |
| Daily Pivot Point S1 | 0.9118 |
| Daily Pivot Point S2 | 0.9086 |
| Daily Pivot Point S3 | 0.9056 |
| Daily Pivot Point R1 | 0.9180 |
| Daily Pivot Point R2 | 0.9210 |
| Daily Pivot Point R3 | 0.9242 |
[/s2If]
Join Our Telegram Group
")


