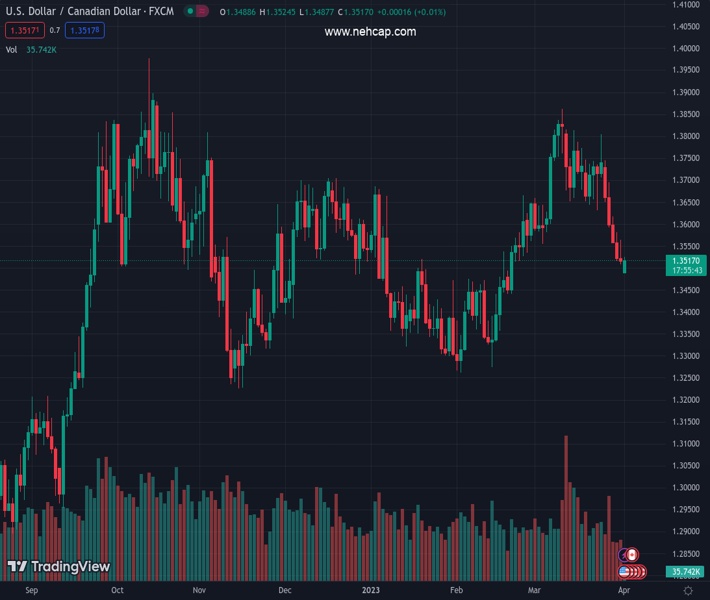
#USDCAD @ 1.35151 pares intraday losses at the lowest levels in six weeks., @nehcap view: Further downside expected (Pivot Orderbook analysis)
…
This is a premium post.
[s2If !current_user_can(access_s2member_level4)]Please register for PREMIUM VERSION HERE to read full post below containing analysis. In case of any error or you think you are not able to read the full post below, please email us at support#nehcap.com [lwa][/s2If] [s2If current_user_can(access_s2member_level4)]
- USD/CAD pares intraday losses at the lowest levels in six weeks.
- Clear downside break of two-month-old ascending trend line, 100-DMA favor sellers.
- 61.8% Fibonacci retracement level lures sellers amid bearish MACD signals.
- Loonie pair buyers should remain cautious below 1.3650-55.
The pair currently trades last at 1.35151.
The previous day high was 1.3564 while the previous day low was 1.3508. The daily 38.2% Fib levels comes at 1.3529, expected to provide resistance. Similarly, the daily 61.8% fib level is at 1.3543, expected to provide resistance.
USD/CAD licks its wounds around 1.3500 after refreshing the 1.5-month low early Monday.
In doing so, the Loonie pair sellers take a breather after breaking the short-term key support line, now resistance, as well as the 100-DMA. Not only the DMA and support line break but the bearish MACD signals also keep the USD/CAD pair sellers hopeful.
That said, the quote is on the way to testing the 61.8% Fibonacci retracement level of its November 2022 to March 2023 upside, near 1.3470. However, the RSI (14) slides below the 50 level and suggest dip-buying at lower levels, which in turn can test the USD/CAD bears afterward.
Should the quote remains bearish past 1.3470, multiple levels around 1.3390 and 1.3320 can test the USD/CAD sellers before highlighting an upward-sloping support line from November 15, 2022, close to 1.3300 by the press time.
Meanwhile, the 100-DMA and the previous support line restrict short-term USD/CAD rebound near 1.3525 and 1.3565 in that order.
However, a horizontal area comprising multiple levels marked since late February 2023, near 1.3650-55, appears a tough nut to crack for the USD/CAD, a break of which could push back the bearish hopes, at least for a while
Trend: Further downside expected
Technical Levels: Supports and Resistances
USDCAD currently trading at 1.3507 at the time of writing. Pair opened at 1.3519 and is trading with a change of -0.09% % .
| Overview | Overview.1 | |
|---|---|---|
| 0 | Today last price | 1.3507 |
| 1 | Today Daily Change | -0.0012 |
| 2 | Today Daily Change % | -0.09% |
| 3 | Today daily open | 1.3519 |
The pair is trading below its 20 Daily moving average @ 1.3695, below its 50 Daily moving average @ 1.3543 , below its 100 Daily moving average @ 1.3522 and above its 200 Daily moving average @ 1.3375
| Trends | Trends.1 | |
|---|---|---|
| 0 | Daily SMA20 | 1.3695 |
| 1 | Daily SMA50 | 1.3543 |
| 2 | Daily SMA100 | 1.3522 |
| 3 | Daily SMA200 | 1.3375 |
The previous day high was 1.3564 while the previous day low was 1.3508. The daily 38.2% Fib levels comes at 1.3529, expected to provide resistance. Similarly, the daily 61.8% fib level is at 1.3543, expected to provide resistance.
Note the levels of interest below:
- Pivot support is noted at 1.3496, 1.3474, 1.344
- Pivot resistance is noted at 1.3553, 1.3587, 1.361
| Levels | Levels.1 |
|---|---|
| Previous Daily High | 1.3564 |
| Previous Daily Low | 1.3508 |
| Previous Weekly High | 1.3745 |
| Previous Weekly Low | 1.3508 |
| Previous Monthly High | 1.3862 |
| Previous Monthly Low | 1.3508 |
| Daily Fibonacci 38.2% | 1.3529 |
| Daily Fibonacci 61.8% | 1.3543 |
| Daily Pivot Point S1 | 1.3496 |
| Daily Pivot Point S2 | 1.3474 |
| Daily Pivot Point S3 | 1.3440 |
| Daily Pivot Point R1 | 1.3553 |
| Daily Pivot Point R2 | 1.3587 |
| Daily Pivot Point R3 | 1.3610 |
[/s2If]
Join Our Telegram Group
")


