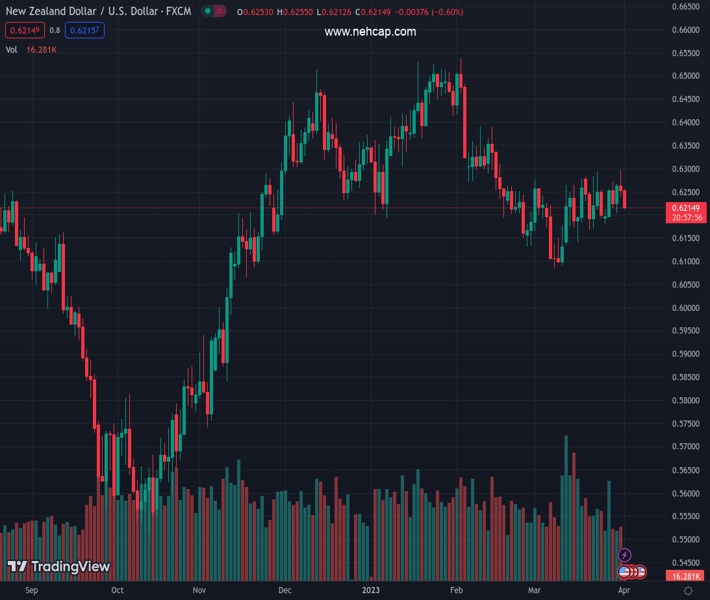
#NZDUSD @ 0.62231 bears are in the market testing dynamic support. (Pivot Orderbook analysis)
…
This is a premium post.
[s2If !current_user_can(access_s2member_level4)]Please register for PREMIUM VERSION HERE to read full post below containing analysis. In case of any error or you think you are not able to read the full post below, please email us at support#nehcap.com [lwa][/s2If] [s2If current_user_can(access_s2member_level4)]
- NZD/USD bears are in the market testing dynamic support.
- Risk-off tones due to higher oil prices are dominating ahead of RBNZ.
The pair currently trades last at 0.62231.
The previous day high was 0.6298 while the previous day low was 0.6237. The daily 38.2% Fib levels comes at 0.6261, expected to provide resistance. Similarly, the daily 61.8% fib level is at 0.6275, expected to provide resistance.
NZD/USD is lower on the day by some 0.3% after falling from a high of 0.6255 to a low of 0.6232 so far. Risk-off markets are kicking in on the back of the weekend news regarding the oil production cut and soaring oil prices.
Saudi Arabia and other OPEC+ oil producers have announced further oil output cuts of around 1.16 million barrels per day. In a statement, the Saudi energy ministry said that the kingdom’s voluntary cut was a precautionary measure aimed at supporting the stability of the oil market. Consequently, WTI crude oil opened for the week with a significant price gap to print $81.51 during the early hours of Monday’s Asian session.
Meanwhile, domestically, this week the focus shifts to the Reserve Bank of New Zealand. ´´While they’re likely to acknowledge risks around financial instability, NZ is remote from all that, and we think the inflation risks relating to the cyclone recovery in an already capacity-constrained economy are a bigger story,´´ analysts at ANZ Bank said, adding, ´´that could help the NZD this week.´´
Meanwhile, analysts at TD Securities noted that the February Monetary Policy Statement noted the Bank thinks further hikes are needed. ´´Aside from Gross Domestic Product, other data suggest the Bank will continue hiking. The Bank may acknowledge the turmoil in US and EU financials but conclude NZ banks are in good shape,´´ the analysts said. ´´To the extent, offshore lending standards tighten and our Fed terminal rate is now lower, this implies downside risk to our 5.50% terminal rate forecast,´´ the analysts concluded.
The price is testing the dynamic support line on the daily chart and the M-formation is in play. If the bulls commit, a retest of the neckline and prior support might be expected to result in a downside continuation to break the dynamic trendline support.
Technical Levels: Supports and Resistances
NZDUSD currently trading at 0.6234 at the time of writing. Pair opened at 0.6261 and is trading with a change of -0.43 % .
| Overview | Overview.1 | |
|---|---|---|
| 0 | Today last price | 0.6234 |
| 1 | Today Daily Change | -0.0027 |
| 2 | Today Daily Change % | -0.4300 |
| 3 | Today daily open | 0.6261 |
The pair is trading above its 20 Daily moving average @ 0.6204, below its 50 Daily moving average @ 0.6279 , below its 100 Daily moving average @ 0.6295 and above its 200 Daily moving average @ 0.6159
| Trends | Trends.1 | |
|---|---|---|
| 0 | Daily SMA20 | 0.6204 |
| 1 | Daily SMA50 | 0.6279 |
| 2 | Daily SMA100 | 0.6295 |
| 3 | Daily SMA200 | 0.6159 |
The previous day high was 0.6298 while the previous day low was 0.6237. The daily 38.2% Fib levels comes at 0.6261, expected to provide resistance. Similarly, the daily 61.8% fib level is at 0.6275, expected to provide resistance.
Note the levels of interest below:
- Pivot support is noted at 0.6233, 0.6205, 0.6173
- Pivot resistance is noted at 0.6294, 0.6326, 0.6354
| Levels | Levels.1 |
|---|---|
| Previous Daily High | 0.6298 |
| Previous Daily Low | 0.6237 |
| Previous Weekly High | 0.6298 |
| Previous Weekly Low | 0.6180 |
| Previous Monthly High | 0.6298 |
| Previous Monthly Low | 0.6084 |
| Daily Fibonacci 38.2% | 0.6261 |
| Daily Fibonacci 61.8% | 0.6275 |
| Daily Pivot Point S1 | 0.6233 |
| Daily Pivot Point S2 | 0.6205 |
| Daily Pivot Point S3 | 0.6173 |
| Daily Pivot Point R1 | 0.6294 |
| Daily Pivot Point R2 | 0.6326 |
| Daily Pivot Point R3 | 0.6354 |
[/s2If]
Join Our Telegram Group
")


