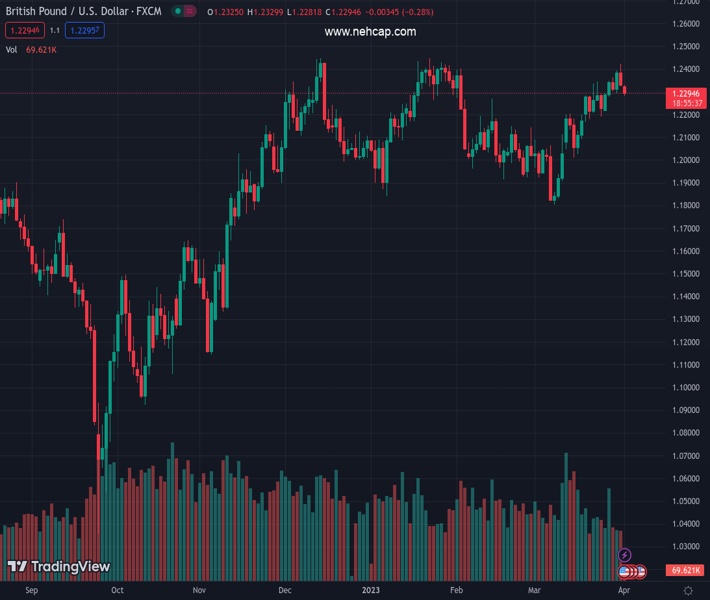
#GBPUSD @ 1.22970 has rebounded in an attempt to defend the 1.2300 support. (Pivot Orderbook analysis)
…
This is a premium post.
[s2If !current_user_can(access_s2member_level4)]Please register for PREMIUM VERSION HERE to read full post below containing analysis. In case of any error or you think you are not able to read the full post below, please email us at support#nehcap.com [lwa][/s2If] [s2If current_user_can(access_s2member_level4)]
- GBP/USD has rebounded in an attempt to defend the 1.2300 support.
- S&P500 futures have reported significant losses as higher oil prices would accelerate input costs.
- The Fed would look for raising rates further in May if inflation gets exploded with solid oil prices.
The pair currently trades last at 1.22970.
The previous day high was 1.2424 while the previous day low was 1.2324. The daily 38.2% Fib levels comes at 1.2362, expected to provide resistance. Similarly, the daily 61.8% fib level is at 1.2386, expected to provide resistance.
The GBP/USD pair is making efforts in defending its round-level support of 1.2300 in the Asian session. The Cable witnessed a sheer decline in the early Tokyo session as investors discounted the impact of higher oil prices after an announcement of further oil production cuts by OPEC+. A significant jump in the oil price has renewed fears of a rebound in inflationary pressures globally. Therefore, central banks might be required to continue higher rates for a lengthy period.
S&P500 futures have reported significant losses in the Asian session after a spree of bullish sessions last week as higher oil prices would accelerate input costs for firms banking on oil for transportation and manufacturing. The market sentiment has turned negative and risk-perceived assets have taken the bullet.
The US Dollar Index (DXY) is showing minor correction after printing a fresh weekly high at 102.95. The upside in the USD Index looks favored as renewed inflation hopes in the United States due to higher oil prices have faded the impact of the deceleration in the US core Personal Consumption Expenditure (PCE) Price Index data.
On a monthly basis, the US PCE Price Index accelerated by 0.3%, lower than the consensus of 0.4% and the former release of 0.5%. Also, the annual US PCE Inflation figure soften to 4.6% from the consensus and prior release of 4.7%.
The Federal Reserve (Fed) would look for raising rates further in May if inflation gets exploded with solid oil prices.
On the Pound Sterling front, rising inflationary pressures are creating more troubles for the Bank of England (BoE). United Kingdom’s shop price inflation has soared further as food prices are escalating further. Apart from that, shortages of labor continue to propel inflation expectations. However, BoE policymakers are confident that UK inflation will start declining quickly.
Technical Levels: Supports and Resistances
GBPUSD currently trading at 1.2304 at the time of writing. Pair opened at 1.2338 and is trading with a change of -0.28 % .
| Overview | Overview.1 | |
|---|---|---|
| 0 | Today last price | 1.2304 |
| 1 | Today Daily Change | -0.0034 |
| 2 | Today Daily Change % | -0.2800 |
| 3 | Today daily open | 1.2338 |
The pair remains strongly bullish on the daily timeframe. It trades above its 20 SMA @ 1.2163, 50 SMA 1.2149, 100 SMA @ 1.213 and 200 SMA @ 1.1895.
| Trends | Trends.1 | |
|---|---|---|
| 0 | Daily SMA20 | 1.2163 |
| 1 | Daily SMA50 | 1.2149 |
| 2 | Daily SMA100 | 1.2130 |
| 3 | Daily SMA200 | 1.1895 |
The previous day high was 1.2424 while the previous day low was 1.2324. The daily 38.2% Fib levels comes at 1.2362, expected to provide resistance. Similarly, the daily 61.8% fib level is at 1.2386, expected to provide resistance.
Note the levels of interest below:
- Pivot support is noted at 1.23, 1.2262, 1.2201
- Pivot resistance is noted at 1.2399, 1.2461, 1.2499
| Levels | Levels.1 |
|---|---|
| Previous Daily High | 1.2424 |
| Previous Daily Low | 1.2324 |
| Previous Weekly High | 1.2424 |
| Previous Weekly Low | 1.2219 |
| Previous Monthly High | 1.2424 |
| Previous Monthly Low | 1.1803 |
| Daily Fibonacci 38.2% | 1.2362 |
| Daily Fibonacci 61.8% | 1.2386 |
| Daily Pivot Point S1 | 1.2300 |
| Daily Pivot Point S2 | 1.2262 |
| Daily Pivot Point S3 | 1.2201 |
| Daily Pivot Point R1 | 1.2399 |
| Daily Pivot Point R2 | 1.2461 |
| Daily Pivot Point R3 | 1.2499 |
[/s2If]
Join Our Telegram Group
")


