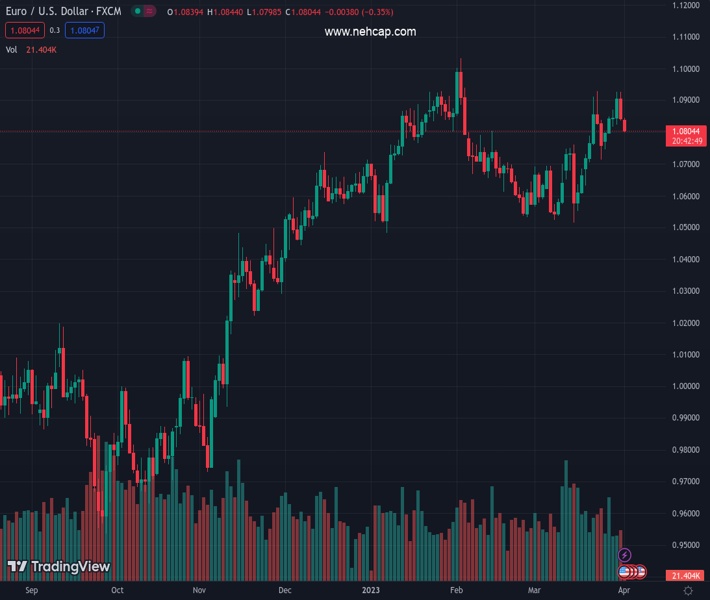
#EURUSD @ 1.08070 takes offers to refresh intraday low, extends Friday’s losses after two-week uptrend. (Pivot Orderbook analysis)
…
This is a premium post.
[s2If !current_user_can(access_s2member_level4)]Please register for PREMIUM VERSION HERE to read full post below containing analysis. In case of any error or you think you are not able to read the full post below, please email us at support#nehcap.com [lwa][/s2If] [s2If current_user_can(access_s2member_level4)]
- EUR/USD takes offers to refresh intraday low, extends Friday’s losses after two-week uptrend.
- Softer Eurozone inflation numbers contrast with upbeat prints of monthly US Core PCE Price Index to weigh on Euro pair.
- OPEC+ production cut adds strength to inflation woes and propels US Dollar’s haven demand.
- US NFP will be crucial amid easing hawkish Fed bets, PMIs eyed too.
The pair currently trades last at 1.08070.
The previous day high was 1.0926 while the previous day low was 1.0837. The daily 38.2% Fib levels comes at 1.0871, expected to provide resistance. Similarly, the daily 61.8% fib level is at 1.0892, expected to provide resistance.
EUR/USD pares gains made in the last two consecutive weeks around 1.0800 as traders brace for the all-important US Nonfarm Payrolls (NFP) during early Monday. Adding strength to the pullback moves could be the recent fears of escalating pressure on prices and downbeat Eurozone inflation numbers versus firmer prints of the Federal Reserve’s (Fed) favorite inflation gauge.
The recent surprise supply cut from the Organization of the Petroleum Exporting Countries (OPEC) and allies led by Russia, known as OPEC+, renew inflation fears and propel the concerns of higher rates, which in turn underpinned the US Dollar’s haven demand.
Adding strength to the US Dollar could be the recently firmer inflation signals as the US Core Personal Consumption Expenditures (PCE) Price Index, the Fed’s preferred gauge of inflation, declined to 4.6% YoY in February from 4.7% expected and prior. On a monthly basis, Core PCE inflation rose 0.3% while easing below the market expectation of 0.4% and a downwardly revised 0.5% previous reading.
On the other hand, the Eurozone Harmonised Index of Consumer Prices (HICP), the European Central Bank’s (ECB) preferred version of inflation, eased to 6.5% YoY in March versus February’s 8.5% and 7.1% market forecasts. It’s worth noting, however, that the Core HICP matched 5.7% analysts’ estimations and 5.6% prior. The monthly figures were more interesting as the headline HICP rose by 0.9% in March vs. 0.8% expectations and 0.8% previous while the Core HICP jumped by 1.2% compared to 0.6% expected and 0.8% seen in February.
It should be noted that the latest comments from the European Central Bank (ECB) Officials, namely from Vice-President Luis de Guindos and policymaker Fabio Panetta hint at easing inflation pressure but defend the hawkish monetary policy bias. On the other hand, Fed Chairman Jerome Powell pushed for one more rate hike while Federal Reserve Bank of Boston President Susan Collins highlighted the importance of higher rates to tame inflation during her latest speeches. On the same line, Federal Reserve Bank of New York President John C. Williams said that he expects inflation to decline to around 3-1/4 percent this year, before moving closer to our longer-run goal in the next two years.
Against this backdrop, S&P 500 Futures print mild losses despite the upbeat closing of Wall Street whereas yields grind higher after a three-day downtrend.
Moving on, US ISM Manufacturing PMI and S&P Global Manufacturing PMI for March can direct intraday moves but major attention should be given to Friday’s US jobs report and headlines suggesting inflation woes.
A clear downside break of a two-week-long ascending support line, now immediate resistance near 1.0910, directs EUR/USD bears towards the 50-DMA support of around 1.0730.
Technical Levels: Supports and Resistances
EURUSD currently trading at 1.0802 at the time of writing. Pair opened at 1.084 and is trading with a change of -0.35% % .
| Overview | Overview.1 | |
|---|---|---|
| 0 | Today last price | 1.0802 |
| 1 | Today Daily Change | -0.0038 |
| 2 | Today Daily Change % | -0.35% |
| 3 | Today daily open | 1.084 |
The pair remains strongly bullish on the daily timeframe. It trades above its 20 SMA @ 1.0724, 50 SMA 1.0732, 100 SMA @ 1.0651 and 200 SMA @ 1.0342.
| Trends | Trends.1 | |
|---|---|---|
| 0 | Daily SMA20 | 1.0724 |
| 1 | Daily SMA50 | 1.0732 |
| 2 | Daily SMA100 | 1.0651 |
| 3 | Daily SMA200 | 1.0342 |
The previous day high was 1.0926 while the previous day low was 1.0837. The daily 38.2% Fib levels comes at 1.0871, expected to provide resistance. Similarly, the daily 61.8% fib level is at 1.0892, expected to provide resistance.
Note the levels of interest below:
- Pivot support is noted at 1.0809, 1.0779, 1.072
- Pivot resistance is noted at 1.0898, 1.0956, 1.0987
| Levels | Levels.1 |
|---|---|
| Previous Daily High | 1.0926 |
| Previous Daily Low | 1.0837 |
| Previous Weekly High | 1.0926 |
| Previous Weekly Low | 1.0745 |
| Previous Monthly High | 1.0930 |
| Previous Monthly Low | 1.0516 |
| Daily Fibonacci 38.2% | 1.0871 |
| Daily Fibonacci 61.8% | 1.0892 |
| Daily Pivot Point S1 | 1.0809 |
| Daily Pivot Point S2 | 1.0779 |
| Daily Pivot Point S3 | 1.0720 |
| Daily Pivot Point R1 | 1.0898 |
| Daily Pivot Point R2 | 1.0956 |
| Daily Pivot Point R3 | 1.0987 |
[/s2If]
Join Our Telegram Group
")


