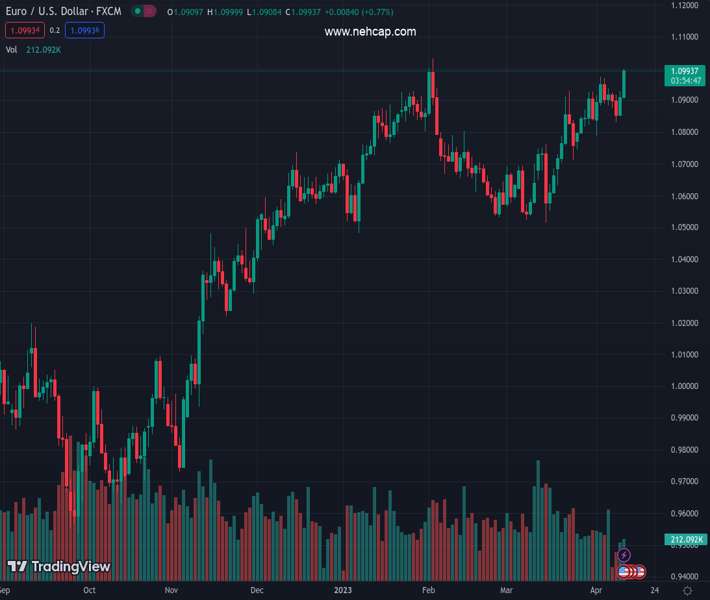
#EURUSD @ 1.07913 extends pullback from 10-week-old horizontal resistance, renews intraday low of late., @nehcap view: Limited downside expected (Pivot Orderbook analysis)
…
This is a premium post.
[s2If !current_user_can(access_s2member_level4)]Please register for PREMIUM VERSION HERE to read full post below containing analysis. In case of any error or you think you are not able to read the full post below, please email us at support#nehcap.com [lwa][/s2If] [s2If current_user_can(access_s2member_level4)]
- EUR/USD extends pullback from 10-week-old horizontal resistance, renews intraday low of late.
- Downside break of 13-day-old support line, easing bullish bias of MACD signals add strength to bearish view.
- Convergence of 50-DMA, 21-DMA joins RSI (14) retreat to challenge EUR/USD bears.
- Receding hawkish hopes from Fed, recently mixed US data prod Euro pair sellers.
The pair currently trades last at 1.07913.
The previous day high was 1.0926 while the previous day low was 1.0837. The daily 38.2% Fib levels comes at 1.0871, expected to provide resistance. Similarly, the daily 61.8% fib level is at 1.0892, expected to provide resistance.
EUR/USD takes offers to renew intraday low around 1.0790 as it extends the previous U-turn from a short-term key hurdle during early Monday. Adding strength to the downside bias is the clear break of a two-week-old support line, now resistance, as well as the receding bullish bias of the MACD. It should be observed that the RSI (14) line retreats towards the 50 level, which in turn suggests further grinding towards the south.
Hence, the EUR/USD price is well-set to test the 1.0730 support confluence including the 50-DMA and 21-DMA as traders begin the key week.
Also read: EUR/USD sellers attack 1.0800 as risk aversion joins consolidation ahead of US PMI, NFP
In a case where the Euro pair remains weaker past 1.0730, the 1.0700 threshold may act as an intermediate halt before directing the major currency pair towards the previous monthly low surrounding 1.0520-15.
On the flip side, the support-turned-resistance line and the aforementioned horizontal resistance area, respectively near 1.0880 and 1.0930, challenge the EUR/USD pair buyers.
Following that, the 1.1000 psychological magnet may act as an intermediate halt before directing the Euro bulls towards the February 2023 high of around 1.1035.
Overall, EUR/USD is likely to decline further but the downside room below 1.0730 appears limited.
Trend: Limited downside expected
Technical Levels: Supports and Resistances
EURUSD currently trading at 1.0791 at the time of writing. Pair opened at 1.084 and is trading with a change of -0.45% % .
| Overview | Overview.1 | |
|---|---|---|
| 0 | Today last price | 1.0791 |
| 1 | Today Daily Change | -0.0049 |
| 2 | Today Daily Change % | -0.45% |
| 3 | Today daily open | 1.084 |
The pair remains strongly bullish on the daily timeframe. It trades above its 20 SMA @ 1.0724, 50 SMA 1.0732, 100 SMA @ 1.0651 and 200 SMA @ 1.0342.
| Trends | Trends.1 | |
|---|---|---|
| 0 | Daily SMA20 | 1.0724 |
| 1 | Daily SMA50 | 1.0732 |
| 2 | Daily SMA100 | 1.0651 |
| 3 | Daily SMA200 | 1.0342 |
The previous day high was 1.0926 while the previous day low was 1.0837. The daily 38.2% Fib levels comes at 1.0871, expected to provide resistance. Similarly, the daily 61.8% fib level is at 1.0892, expected to provide resistance.
Note the levels of interest below:
- Pivot support is noted at 1.0809, 1.0779, 1.072
- Pivot resistance is noted at 1.0898, 1.0956, 1.0987
| Levels | Levels.1 |
|---|---|
| Previous Daily High | 1.0926 |
| Previous Daily Low | 1.0837 |
| Previous Weekly High | 1.0926 |
| Previous Weekly Low | 1.0745 |
| Previous Monthly High | 1.0930 |
| Previous Monthly Low | 1.0516 |
| Daily Fibonacci 38.2% | 1.0871 |
| Daily Fibonacci 61.8% | 1.0892 |
| Daily Pivot Point S1 | 1.0809 |
| Daily Pivot Point S2 | 1.0779 |
| Daily Pivot Point S3 | 1.0720 |
| Daily Pivot Point R1 | 1.0898 |
| Daily Pivot Point R2 | 1.0956 |
| Daily Pivot Point R3 | 1.0987 |
[/s2If]
Join Our Telegram Group
")


