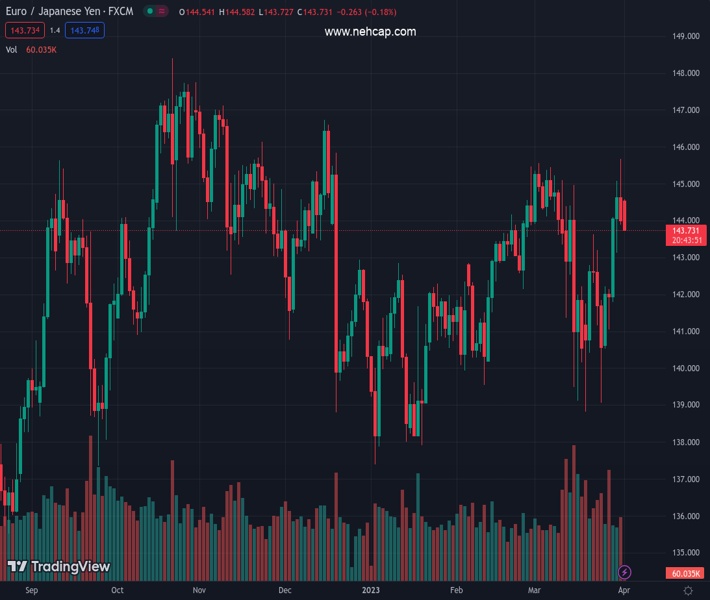
#EURJPY @ 143.745 has failed to capitalize on the Japanese Yen’s weakness inspired by upbeat oil prices. (Pivot Orderbook analysis)
…
This is a premium post.
[s2If !current_user_can(access_s2member_level4)]Please register for PREMIUM VERSION HERE to read full post below containing analysis. In case of any error or you think you are not able to read the full post below, please email us at support#nehcap.com [lwa][/s2If] [s2If current_user_can(access_s2member_level4)]
- EUR/JPY has failed to capitalize on the Japanese Yen’s weakness inspired by upbeat oil prices.
- A surprise rise in the Eurozone inflation is expected to force the ECB to continue its policy-tightening spell.
- The cross has witnessed a correction after a strong upside, which would be a mean reversion move to near the 20-EMA.
The pair currently trades last at 143.745.
The previous day high was 145.67 while the previous day low was 143.89. The daily 38.2% Fib levels comes at 144.57, expected to provide resistance. Similarly, the daily 61.8% fib level is at 144.99, expected to provide resistance.
The EUR/JPY pair has dropped sharply to near 144.00 after a short-lived pullback to 144.50 in the Asian session. In early Asia, the cross showed a severe bullish response to the headline of the surprise cut in oil production by OPEC+. However, the less-confident move has faded for now.
The Japanese Yen came under intense pressure after a stellar jump in the oil price, being Japan one of the leading importers of oil in the world.
On the Eurozone front, preliminary Harmonized Index of Consumer Prices (HICP) (March) data kept the Euro in action. The headline HICP softened to 6.9% from the consensus and the prior release of 7.1% and 8.5% respectively. However, the monthly figure elevated to 0.9% vs. the estimates and February’s figure of 0.8%. And, core monthly HICP figure soared to 1.2% from the expectations of 0.6%.
A surprise rise in the Eurozone inflation is expected to force the European Central Bank (ECB) to continue to announce more rates to tame the stubborn inflation.
On a four-hour scale, EUR/JPY has dropped strongly after facing tough barricades near the horizontal resistance plotted from February 28 high at 145.47. The cross has witnessed a correction after a strong upside, which is likely to be a mean reversion move to near the 20-period Exponential Moving Average (EMA) around 143.85.
The Relative Strength Index (RSI) (14) has slipped into the 40.00-60.00 range, which indicates a loss in the upside momentum, and the upside bias has not faded yet.
Going forward, a break above the intraday high at 144.58 would drive the asset towards March 31 high at 145.67 followed by December 16 high at 146.72.
On the flip side, a break below March 30 low at 143.13 would drag the cross toward March 14 low at 142.53 and March 13 low at 141.57.
Technical Levels: Supports and Resistances
EURJPY currently trading at 144.06 at the time of writing. Pair opened at 144.07 and is trading with a change of -0.01 % .
| Overview | Overview.1 | |
|---|---|---|
| 0 | Today last price | 144.06 |
| 1 | Today Daily Change | -0.01 |
| 2 | Today Daily Change % | -0.01 |
| 3 | Today daily open | 144.07 |
The pair remains strongly bullish on the daily timeframe. It trades above its 20 SMA @ 142.91, 50 SMA 142.65, 100 SMA @ 142.55 and 200 SMA @ 141.85.
| Trends | Trends.1 | |
|---|---|---|
| 0 | Daily SMA20 | 142.91 |
| 1 | Daily SMA50 | 142.65 |
| 2 | Daily SMA100 | 142.55 |
| 3 | Daily SMA200 | 141.85 |
The previous day high was 145.67 while the previous day low was 143.89. The daily 38.2% Fib levels comes at 144.57, expected to provide resistance. Similarly, the daily 61.8% fib level is at 144.99, expected to provide resistance.
Note the levels of interest below:
- Pivot support is noted at 143.42, 142.76, 141.63
- Pivot resistance is noted at 145.2, 146.33, 146.98
| Levels | Levels.1 |
|---|---|
| Previous Daily High | 145.67 |
| Previous Daily Low | 143.89 |
| Previous Weekly High | 145.67 |
| Previous Weekly Low | 140.57 |
| Previous Monthly High | 145.67 |
| Previous Monthly Low | 138.83 |
| Daily Fibonacci 38.2% | 144.57 |
| Daily Fibonacci 61.8% | 144.99 |
| Daily Pivot Point S1 | 143.42 |
| Daily Pivot Point S2 | 142.76 |
| Daily Pivot Point S3 | 141.63 |
| Daily Pivot Point R1 | 145.20 |
| Daily Pivot Point R2 | 146.33 |
| Daily Pivot Point R3 | 146.98 |
[/s2If]
Join Our Telegram Group
")


