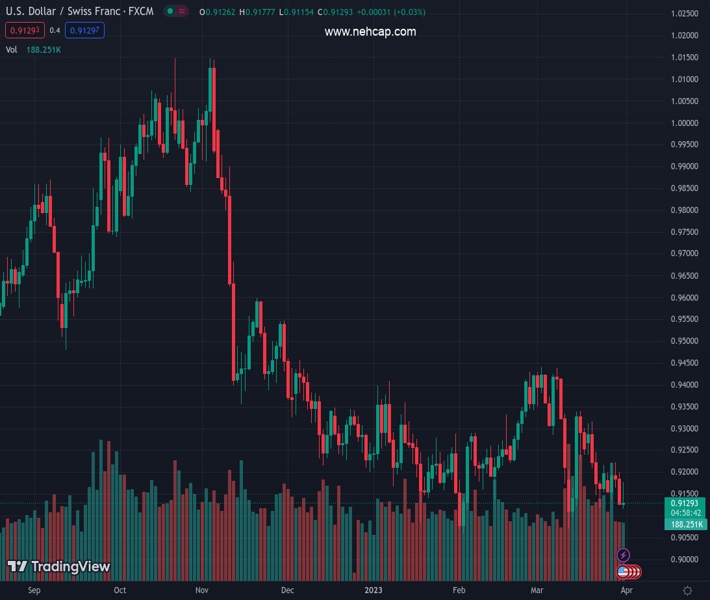
#USDCHF @ 0.91302 drops as US core PCE rose by 4.6% YoY, below the previous month. (Pivot Orderbook analysis)
…
This is a premium post.
[s2If !current_user_can(access_s2member_level4)]Please register for PREMIUM VERSION HERE to read full post below containing analysis. In case of any error or you think you are not able to read the full post below, please email us at support#nehcap.com [lwa][/s2If] [s2If current_user_can(access_s2member_level4)]
- USD/CHF drops as US core PCE rose by 4.6% YoY, below the previous month.
- The University of Michigan’s Consumer Sentiment was below expected.
- USD/CHF Price Analysis:
- Presses toward 0.9100, but sellers struggle to break that support below.
The pair currently trades last at 0.91302.
The previous day high was 0.9201 while the previous day low was 0.9126. The daily 38.2% Fib levels comes at 0.9155, expected to provide resistance. Similarly, the daily 61.8% fib level is at 0.9172, expected to provide resistance.
USD/CHF falls to a new weekly low below 0.9126, sponsored by economic data from the United States (US) showing that inflation is cooling down. Hence, bets that the US Federal Reserve (Fed) might pause its tightening cycle, increasing, meaning the greenback would be under pressure. At the time of writing, the USD/CHF is trading at 0.9127, below its opening price.
The Federal Reserve’s preferred gauge for inflation, the core Personal Consumption Expenditure (PCE), rose by 4.6% YoY, below the previous month’s 4.7%. On a monthly basis, inflation that excludes food and energy rose by 0.3%, below estimates of 0.4%.
Of late, the University of Michigan’s (UoM) Consumer Sentiment was below estimates of 67 and came at 62. According to Joanne Hsu, director of the survey, said, “Overall, our data revealed multiple signs that consumers increasingly expect a recession ahead.” The same study showed that inflation expectations for one year stood at 3.6%, down from 3.8%, while for a 5-year horizon, consumers estimate inflation at 2.9%.
The USD/CHF extended its losses amidst positive news on the US front. Although the Boston Fed President Susan Collins welcomed the data, she said it hadn’t changed her outlook, adding that the Fed has more work to do.
On the Switzerland front, the Swiss National Bank (SNB) continued to tighten monetary conditions when it raised rates by 50 bps on March 23 toward the 1.50% area. Furthermore, Retail Sales in February rose by 0.3% compared with the previous year, giving a leg-down to the USD/CHF pair.
Even though the USD/CHF continued to press towards the 0.9100 figure, the sellers could not register a decisive break below the latter. Technical indicators like the Relative Strength Index (RSI) and the Rate of Change (RoC) are flat, suggesting that sellers are jumping from the boat. However, if the USD/CHF dives below 0.9100, that would open the door to challenge the YTD low at 0.9059. On the flip side, buyers reclaiming 0.9150 could pave the way for a recovery to 0.9200 and beyond.
Technical Levels: Supports and Resistances
USDCHF currently trading at 0.9131 at the time of writing. Pair opened at 0.9129 and is trading with a change of 0.02 % .
| Overview | Overview.1 | |
|---|---|---|
| 0 | Today last price | 0.9131 |
| 1 | Today Daily Change | 0.0002 |
| 2 | Today Daily Change % | 0.0200 |
| 3 | Today daily open | 0.9129 |
The pair remains strongly bearish on the daily time frame. It trades below the 20 SMA @ 0.9247, 50 SMA 0.9251, 100 SMA @ 0.93 and 200 SMA @ 0.9521.
| Trends | Trends.1 | |
|---|---|---|
| 0 | Daily SMA20 | 0.9247 |
| 1 | Daily SMA50 | 0.9251 |
| 2 | Daily SMA100 | 0.9300 |
| 3 | Daily SMA200 | 0.9521 |
The previous day high was 0.9201 while the previous day low was 0.9126. The daily 38.2% Fib levels comes at 0.9155, expected to provide resistance. Similarly, the daily 61.8% fib level is at 0.9172, expected to provide resistance.
Note the levels of interest below:
- Pivot support is noted at 0.9103, 0.9078, 0.9029
- Pivot resistance is noted at 0.9178, 0.9226, 0.9252
| Levels | Levels.1 |
|---|---|
| Previous Daily High | 0.9201 |
| Previous Daily Low | 0.9126 |
| Previous Weekly High | 0.9317 |
| Previous Weekly Low | 0.9120 |
| Previous Monthly High | 0.9429 |
| Previous Monthly Low | 0.9059 |
| Daily Fibonacci 38.2% | 0.9155 |
| Daily Fibonacci 61.8% | 0.9172 |
| Daily Pivot Point S1 | 0.9103 |
| Daily Pivot Point S2 | 0.9078 |
| Daily Pivot Point S3 | 0.9029 |
| Daily Pivot Point R1 | 0.9178 |
| Daily Pivot Point R2 | 0.9226 |
| Daily Pivot Point R3 | 0.9252 |
[/s2If]
Join Our Telegram Group
")


