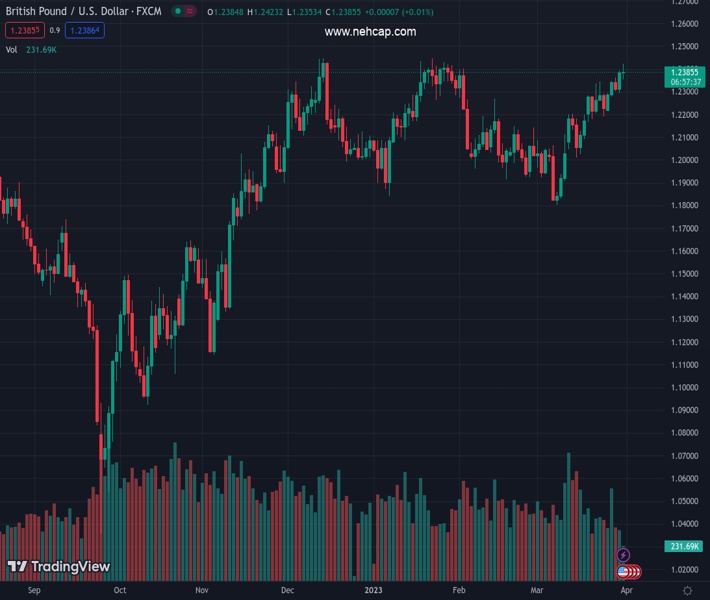
#GBPUSD @ 1.23880 attracts some dip-buying and remains closer to over a two-month high set on Friday. (Pivot Orderbook analysis)
…
This is a premium post.
[s2If !current_user_can(access_s2member_level4)]Please register for PREMIUM VERSION HERE to read full post below containing analysis. In case of any error or you think you are not able to read the full post below, please email us at support#nehcap.com [lwa][/s2If] [s2If current_user_can(access_s2member_level4)]
- GBP/USD attracts some dip-buying and remains closer to over a two-month high set on Friday.
- The USD pares intraday gains in reaction to softer inflation data and lends support to the pair.
- The fundamental backdrop favours bulls and supports prospects for a further appreciating move.
The pair currently trades last at 1.23880.
The previous day high was 1.2393 while the previous day low was 1.2294. The daily 38.2% Fib levels comes at 1.2355, expected to provide support. Similarly, the daily 61.8% fib level is at 1.2332, expected to provide support.
The GBP/USD pair reverses a dip to the 1.2355-1.2350 region and trades in the neutral territory during the early North American session on Friday. The pair, however, remains below over a two-month high touched this Friday and is currently placed around the 1.2380-1.2385 zone, nearly unchanged for the day.
The US Dollar (USD) trims a part of its intraday gains following the release of the Personal Consumption Expenditures (PCE) Price Index and turns out to be a key factor that assists the GBP/USD pair to attract fresh buyers at lower levels. In fact, the US Bureau of Economic Analysis reported that the headline PCE Price Index decelerated to a 5% YoY rate in February – the slowest pace of rise since September 2021. Adding to this, the Fed’s favourite inflation indicator – Core PCE Deflator – edged down to 4.7% during the reported month against consensus estimates pointing to a steady reading of 4.7%.
The data fuels speculations that the Federal Reserve might soon pause the rate-hiking cycle in the wake of the turmoil in the banking sector, which is evident from a fresh leg down in the US Treasury bond yields. This, along with the prevalent risk-on mood, acts as a headwind for the safe-haven Greenback and lends support to the GBP/USD pair. The British Pound is further underpinned by the prospects for additional interest rate hikes by the Bank of England (BoE). The bets were reaffirmed by the UK GDP print, which showed that the economy expanded by 0.1% during the fourth quarter.
The fundamental backdrop favours bullish traders and suggests that the path of least resistance for the GBP/USD pair is to the upside. Hence, any meaningful pullback might still be seen as a buying opportunity and is more likely to remain limited, at least for the time being. Nevertheless, spot prices remain on track to register strong weekly gains and end in the green for the sixth successive week.
Technical Levels: Supports and Resistances
GBPUSD currently trading at 1.2376 at the time of writing. Pair opened at 1.2388 and is trading with a change of -0.1 % .
| Overview | Overview.1 | |
|---|---|---|
| 0 | Today last price | 1.2376 |
| 1 | Today Daily Change | -0.0012 |
| 2 | Today Daily Change % | -0.1000 |
| 3 | Today daily open | 1.2388 |
The pair remains strongly bullish on the daily timeframe. It trades above its 20 SMA @ 1.2149, 50 SMA 1.215, 100 SMA @ 1.2125 and 200 SMA @ 1.1895.
| Trends | Trends.1 | |
|---|---|---|
| 0 | Daily SMA20 | 1.2149 |
| 1 | Daily SMA50 | 1.2150 |
| 2 | Daily SMA100 | 1.2125 |
| 3 | Daily SMA200 | 1.1895 |
The previous day high was 1.2393 while the previous day low was 1.2294. The daily 38.2% Fib levels comes at 1.2355, expected to provide support. Similarly, the daily 61.8% fib level is at 1.2332, expected to provide support.
Note the levels of interest below:
- Pivot support is noted at 1.2324, 1.2259, 1.2225
- Pivot resistance is noted at 1.2423, 1.2458, 1.2522
| Levels | Levels.1 |
|---|---|
| Previous Daily High | 1.2393 |
| Previous Daily Low | 1.2294 |
| Previous Weekly High | 1.2344 |
| Previous Weekly Low | 1.2167 |
| Previous Monthly High | 1.2402 |
| Previous Monthly Low | 1.1915 |
| Daily Fibonacci 38.2% | 1.2355 |
| Daily Fibonacci 61.8% | 1.2332 |
| Daily Pivot Point S1 | 1.2324 |
| Daily Pivot Point S2 | 1.2259 |
| Daily Pivot Point S3 | 1.2225 |
| Daily Pivot Point R1 | 1.2423 |
| Daily Pivot Point R2 | 1.2458 |
| Daily Pivot Point R3 | 1.2522 |
[/s2If]
Join Our Telegram Group
")


