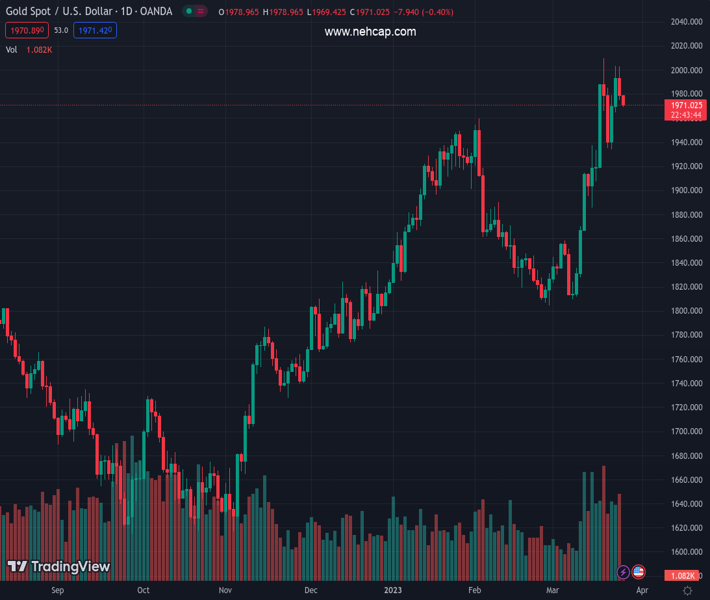
#XAUUSD @ 1,971.41 Gold price has shifted its business below $1,980.00 after solid preliminary US PMI data. (Pivot Orderbook analysis)
…
This is a premium post.
[s2If !current_user_can(access_s2member_level4)]Please register for PREMIUM VERSION HERE to read full post below containing analysis. In case of any error or you think you are not able to read the full post below, please email us at support#nehcap.com [lwa][/s2If] [s2If current_user_can(access_s2member_level4)]
- Gold price has shifted its business below $1,980.00 after solid preliminary US PMI data.
- Solid PMI numbers could force the Fed to continue to hike rates further.
- Fed Kashkari cited recent stress in the banking sector could bring the US closer to recession.
The pair currently trades last at 1971.41.
The previous day high was 2003.07 while the previous day low was 1975.28. The daily 38.2% Fib levels comes at 1985.9, expected to provide resistance. Similarly, the daily 61.8% fib level is at 1992.45, expected to provide resistance.
Gold price (XAU/USD) has shifted its auction below $1,980.00 in the early Asian session. The precious metal is not showing any signs of a rebound, therefore, more downside is anticipated further. Bearish bets for Gold price soared after S&P Global reported upbeat preliminary United States PMI figures (March) on Friday. Manufacturing PMI jumped to 49.3 vs. the consensus of 47.0 and the former release of 47.3. While Services PMI accelerated to 53.8 against the estimates of 50.5 and the prior release of 50.6.
A vertical jump in the overall economic activities indicates that overall demand is robust and the road ahead for pushing US inflation lower would be full of challenges for the Federal Reserve (Fed). Last week, Fed chair Jerome Powell hinted that few rates are in pipeline now to avoid a banking crisis. And now solid PMI numbers could force the Fed to continue to hike rates further.
Meanwhile, Minneapolis Fed president Neel Kashkari cited on Sunday, “Recent stress in the banking sector and the possibility of a follow-on credit crunch brings the US closer to recession. It definitely brings us closer.” It would be a tough call from the Fed to bring more interest rates if recession fears are potential.
Meanwhile, the US Dollar Index (DXY) is juggling in a narrow range below 103.20 after a solid recovery. The USD Index is looking to add gains further despite potential fears of further banking turmoil. S&P500 futures settled on a positive note last week despite sheer volatility inspired by the Fed policy. The impact of dovish interest rate guidance by the Fed was witnessed in US Treasury yields. The 10-year US Treasury yields dropped to 3.37%.
Gold price has shown a break of higher highs and higher lows structure below $1,982.70 after forming a Double Top chart pattern on an hourly scale. The chart pattern indicates a re-test of prior highs with less buying interest, which allows aggressive selling interest to penetrate. The asset has slipped below the 20-period Exponential Moving Average (EMA) at $1,985.00, which indicates that the short-term trend is bearish now.
Meanwhile, the Relative Strength Index (RSI) (14) is defending the 40.00 cushion. A break below the same would drag Gold price further as a bearish momentum will get triggered.
Technical Levels: Supports and Resistances
XAUUSD currently trading at 1977.45 at the time of writing. Pair opened at 1977.45 and is trading with a change of 0.0 % .
| Overview | Overview.1 | |
|---|---|---|
| 0 | Today last price | 1977.45 |
| 1 | Today Daily Change | 0.00 |
| 2 | Today Daily Change % | 0.00 |
| 3 | Today daily open | 1977.45 |
The pair remains strongly bullish on the daily timeframe. It trades above its 20 SMA @ 1892.66, 50 SMA 1887.93, 100 SMA @ 1840.48 and 200 SMA @ 1780.47.
| Trends | Trends.1 | |
|---|---|---|
| 0 | Daily SMA20 | 1892.66 |
| 1 | Daily SMA50 | 1887.93 |
| 2 | Daily SMA100 | 1840.48 |
| 3 | Daily SMA200 | 1780.47 |
The previous day high was 2003.07 while the previous day low was 1975.28. The daily 38.2% Fib levels comes at 1985.9, expected to provide resistance. Similarly, the daily 61.8% fib level is at 1992.45, expected to provide resistance.
Note the levels of interest below:
- Pivot support is noted at 1967.46, 1957.48, 1939.67
- Pivot resistance is noted at 1995.25, 2013.06, 2023.04
| Levels | Levels.1 |
|---|---|
| Previous Daily High | 2003.07 |
| Previous Daily Low | 1975.28 |
| Previous Weekly High | 2009.88 |
| Previous Weekly Low | 1934.34 |
| Previous Monthly High | 1959.80 |
| Previous Monthly Low | 1804.76 |
| Daily Fibonacci 38.2% | 1985.90 |
| Daily Fibonacci 61.8% | 1992.45 |
| Daily Pivot Point S1 | 1967.46 |
| Daily Pivot Point S2 | 1957.48 |
| Daily Pivot Point S3 | 1939.67 |
| Daily Pivot Point R1 | 1995.25 |
| Daily Pivot Point R2 | 2013.06 |
| Daily Pivot Point R3 | 2023.04 |
[/s2If]
Join Our Telegram Group
")


