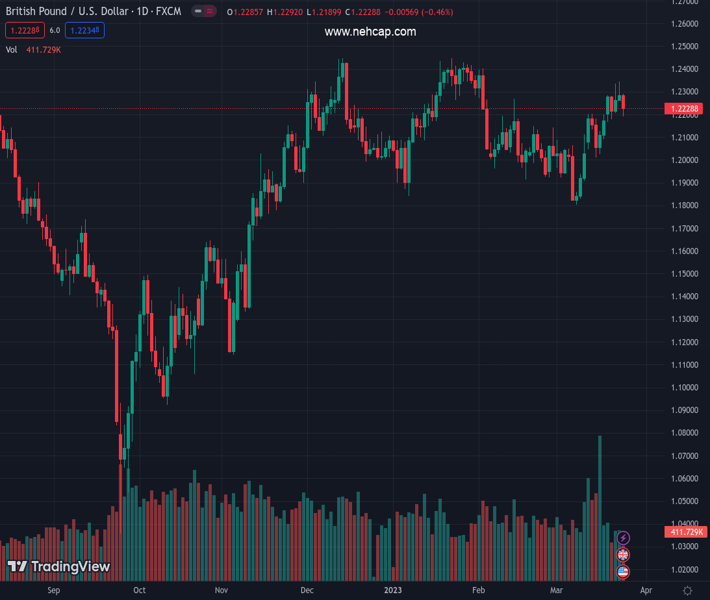
#GBPUSD @ 1.22296 is set to finish the week with gains of around 0.40%. (Pivot Orderbook analysis)
…
This is a premium post.
[s2If !current_user_can(access_s2member_level4)]Please register for PREMIUM VERSION HERE to read full post below containing analysis. In case of any error or you think you are not able to read the full post below, please email us at support#nehcap.com [lwa][/s2If] [s2If current_user_can(access_s2member_level4)]
- GBP/USD is set to finish the week with gains of around 0.40%.
- Federal Reserve officials remained committed to curbing inflation to its 2% target.
- Mixed economic data in the UK, a headwind for the GBP/USD, despite expectations for a Fed rate cut in 2023.
The pair currently trades last at 1.22296.
The previous day high was 1.2344 while the previous day low was 1.2262. The daily 38.2% Fib levels comes at 1.2312, expected to provide resistance. Similarly, the daily 61.8% fib level is at 1.2293, expected to provide resistance.
GBP/USD finished the week on a lower note after it reached 1.234, the high of the week, but retreated as sentiment dampened. On Friday, the GBP/USD is trading at 1.2228, retracing 0.47% at the time of typing.
The US equities market prepares to end the week in positive territory despite a renewed round of turbulence. Deutsche Bank stock fell sharply on fears that the German bank could default, as shown by the Credit Default Swaps (CDS) rising 220 basis points. Although it hurt Wall Street as the session opened, investors shrugged off those fears, as they speculated the Federal Reserve (Fed) would cut rates in 2023.
Federal Reserve officials crossed wires in the session. St. Louis Fed President James Bullard noted that rates need to get to the 5.50%-5.75% range, which would require an additional 75 bps of rate hikes after the Fed’s raised rates to the 4.75%-5.00%. Earlier comments from his colleague Raphael Bostic from the Atlanta Fed said that March’s decision was not easy. “There was a lot of debate. This wasn’t a straightforward decision.”
Richmond Fed President Thomas Barkin commented that the situation in the banking sector “felt very stable by the time we got there (to the meeting). So the conditions were right to do monetary policy the way we want to do monetary policy.”
On the data front, the US economic calendar featured the S&P Global PMI improved in March, exceeding expectations and the prior’s month data. The Manufacturing Index stood in the contractionary territory. At the same time, Durable Good Orders plunged by 1% but improved compared to the last month’s reading.
The UK economic docket featured Retail Sales, which beat estimates on an annual and monthly basis, while the S&P Global PMIs were worse than foreseen. The Manufacturing PMI failed to improve, while the Services and Composite PMIs, ticked slightly down.
Catheryn Mann, a member of the Bank of England, said she voted for a 25 bps rate hike compared to a larger one because she saw signs that inflation expectations are falling.
Given the backdrop, the GBP/USD extended its losses, boosted by a stronger US Dollar. Even though the GBP/USD hit a daily low at 1.2190, buyers could hurdle the 1.2200 mark. It should be said that failure to achieve a daily close above 1.2300 could exacerbate a fall below 1.2200, which could extend to the 20-day EMA around 1.2135. Once cleared, the 200-day EMA would be up for grabs. On the flip side, buyers reclaiming 1.2300 can pave the way to the weekly high of 1.2343.
Technical Levels: Supports and Resistances
GBPUSD currently trading at 1.2232 at the time of writing. Pair opened at 1.2288 and is trading with a change of -0.46 % .
| Overview | Overview.1 | |
|---|---|---|
| 0 | Today last price | 1.2232 |
| 1 | Today Daily Change | -0.0056 |
| 2 | Today Daily Change % | -0.4600 |
| 3 | Today daily open | 1.2288 |
The pair remains strongly bullish on the daily timeframe. It trades above its 20 SMA @ 1.2071, 50 SMA 1.2148, 100 SMA @ 1.2084 and 200 SMA @ 1.1893.
| Trends | Trends.1 | |
|---|---|---|
| 0 | Daily SMA20 | 1.2071 |
| 1 | Daily SMA50 | 1.2148 |
| 2 | Daily SMA100 | 1.2084 |
| 3 | Daily SMA200 | 1.1893 |
The previous day high was 1.2344 while the previous day low was 1.2262. The daily 38.2% Fib levels comes at 1.2312, expected to provide resistance. Similarly, the daily 61.8% fib level is at 1.2293, expected to provide resistance.
Note the levels of interest below:
- Pivot support is noted at 1.2252, 1.2216, 1.217
- Pivot resistance is noted at 1.2334, 1.2379, 1.2415
| Levels | Levels.1 |
|---|---|
| Previous Daily High | 1.2344 |
| Previous Daily Low | 1.2262 |
| Previous Weekly High | 1.2204 |
| Previous Weekly Low | 1.2010 |
| Previous Monthly High | 1.2402 |
| Previous Monthly Low | 1.1915 |
| Daily Fibonacci 38.2% | 1.2312 |
| Daily Fibonacci 61.8% | 1.2293 |
| Daily Pivot Point S1 | 1.2252 |
| Daily Pivot Point S2 | 1.2216 |
| Daily Pivot Point S3 | 1.2170 |
| Daily Pivot Point R1 | 1.2334 |
| Daily Pivot Point R2 | 1.2379 |
| Daily Pivot Point R3 | 1.2415 |
[/s2If]
Join Our Telegram Group
")


