DXY picks up further traction and surpasses the 103.00 mark. (Pivot Orderbook analysis)
…
This is a premium post.
[s2If !current_user_can(access_s2member_level4)]Please register for PREMIUM VERSION HERE to read full post below containing analysis. In case of any error or you think you are not able to read the full post below, please email us at support#nehcap.com [lwa][/s2If] [s2If current_user_can(access_s2member_level4)]
- DXY picks up further traction and surpasses the 103.00 mark.
- Further bounce could see the transitory 100-day SMA revisited.
The pair currently trades last at 103.23.
The previous day high was 102.63 while the previous day low was 101.92. The daily 38.2% Fib levels comes at 102.36, expected to provide support. Similarly, the daily 61.8% fib level is at 102.19, expected to provide support.
DXY leaves behind Thursday’s lows in the sub-102.00 area and retakes the 103.00 mark on quite a convincing note.
The initial up-barrier comes at the temporary 55-day SMA near 103.40, while the continuation of the rebound is expected to meet another provisional resistance at the 100-day SMA at 104.37.
Looking at the broader picture, while below the 200-day SMA, today at 106.60, the outlook for the index is expected to remain negative.
Technical Levels: Supports and Resistances
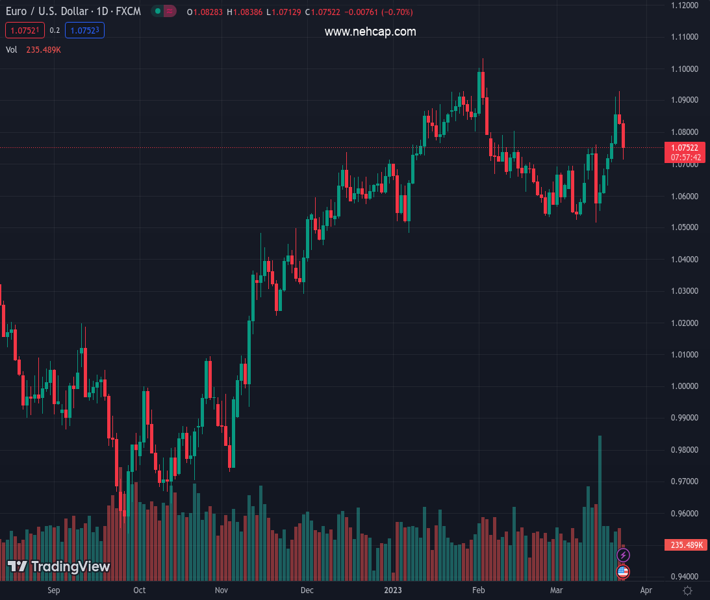
EURUSD currently trading at 103.23 at the time of writing. Pair opened at 102.61 and is trading with a change of 0.6 % .
| Overview | Overview.1 | |
|---|---|---|
| 0 | Today last price | 103.23 |
| 1 | Today Daily Change | 85.00 |
| 2 | Today Daily Change % | 0.60 |
| 3 | Today daily open | 102.61 |
The pair remains strongly bearish on the daily time frame. It trades below the 20 SMA @ 104.31, 50 SMA 103.44, 100 SMA @ 104.22 and 200 SMA @ 106.78.
| Trends | Trends.1 | |
|---|---|---|
| 0 | Daily SMA20 | 104.31 |
| 1 | Daily SMA50 | 103.44 |
| 2 | Daily SMA100 | 104.22 |
| 3 | Daily SMA200 | 106.78 |
The previous day high was 102.63 while the previous day low was 101.92. The daily 38.2% Fib levels comes at 102.36, expected to provide support. Similarly, the daily 61.8% fib level is at 102.19, expected to provide support.
Note the levels of interest below:
- Pivot support is noted at 102.14, 101.67, 101.43
- Pivot resistance is noted at 102.85, 103.1, 103.57
| Levels | Levels.1 |
|---|---|
| Previous Daily High | 102.63 |
| Previous Daily Low | 101.92 |
| Previous Weekly High | 105.11 |
| Previous Weekly Low | 103.44 |
| Previous Monthly High | 105.36 |
| Previous Monthly Low | 100.81 |
| Daily Fibonacci 38.2% | 102.36 |
| Daily Fibonacci 61.8% | 102.19 |
| Daily Pivot Point S1 | 102.14 |
| Daily Pivot Point S2 | 101.67 |
| Daily Pivot Point S3 | 101.43 |
| Daily Pivot Point R1 | 102.85 |
| Daily Pivot Point R2 | 103.10 |
| Daily Pivot Point R3 | 103.57 |
[/s2If]
Join Our Telegram Group
")


