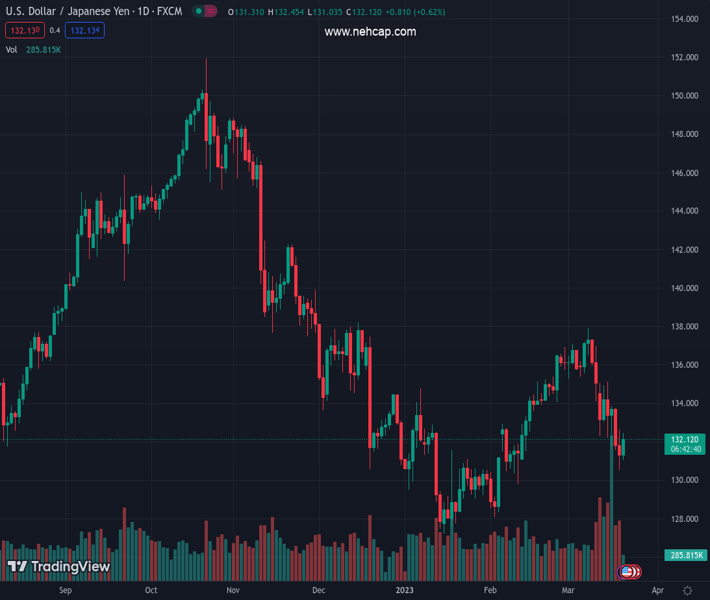
#USDJPY @ 132.195 gains strong positive traction on Tuesday and recovers further from a multi-week low. (Pivot Orderbook analysis)
…
This is a premium post.
[s2If !current_user_can(access_s2member_level4)]Please register for PREMIUM VERSION HERE to read full post below containing analysis. In case of any error or you think you are not able to read the full post below, please email us at support#nehcap.com [lwa][/s2If] [s2If current_user_can(access_s2member_level4)]
- USD/JPY gains strong positive traction on Tuesday and recovers further from a multi-week low.
- The risk-on impulse undermines the JPY and lends support, though weaker USD caps the upside.
- The technical setup warrants some caution before placing directional bets ahead of the FOMC.
The pair currently trades last at 132.195.
The previous day high was 132.65 while the previous day low was 130.54. The daily 38.2% Fib levels comes at 131.34, expected to provide support. Similarly, the daily 61.8% fib level is at 131.84, expected to provide support.
The USD/JPY pair once again shows some resilience below the 61.8% Fibonacci retracement level of the January-March rally and attracts fresh buying near the 131.00 round-figure mark on Tuesday. Spot prices recover further from the lowest level since February 10, around the 130.55-130.50 area touched on Monday, and climb back closer to mid-132.00s during the early North American session.
The risk-on impulse – as depicted by a further strong rally in the equity markets – undermines the safe-haven Japanese Yen (JPY) and acts as a headwind for the USD/JPY pair. Bulls further take cues from the widening of the US-Japan rate differential, led by a solid recovery in the US Treasury bond yields over the past two sessions. That said, the prevalent US Dollar selling might cap any meaningful gains for the major.
The aforementioned mixed fundamental backdrop warrants caution before confirming that the USD/JPY pair’s recent rejection slide from a technically significant 200-day Simple Moving Average (SMA) has run its course. Traders might also refrain from placing aggressive bets and prefer to move to the sidelines ahead of the highly-anticipated two-day FOMC monetary policy meeting, starting this Tuesday.
From a technical perspective, the intraday positive move stalls near 50% Fibo. level. This is closely followed by the overnight swing high, around the 132.65 region, which should now act as a pivotal point. Some follow-through buying could trigger a short-covering rally and push the USD/JPY pair further beyond the 133.00 round figure, towards testing the 38.2% Fibo. level, around the 133.80-133.85 region.
Heading into the key central bank event risk, the latter should keep a lid on any further upside for the USD/JPY pair. That said, a sustained move beyond the said barrier will negate any near-term negative outlook and shift the near-term bias in favour of bullish traders. This, in turn, will set the stage for a further appreciating move towards the 135.00 psychological mark, which coincides with the 100-day SMA.
On the flip side, 61.8% Fibo. level, around the 131.35 region, now seems to protect the immediate downside ahead of the 131.00 mark and the overnight swing low, around the mid-130.00s. Failure to defend the said support levels will make the USD/JPY pair vulnerable to challenging the 130.00 psychological mark. Spot prices could eventually drop to the 129.55-129.50 intermediate support en route to the 129.00 round figure.
Technical Levels: Supports and Resistances
USDJPY currently trading at 132.3 at the time of writing. Pair opened at 131.33 and is trading with a change of 0.74 % .
| Overview | Overview.1 | |
|---|---|---|
| 0 | Today last price | 132.30 |
| 1 | Today Daily Change | 0.97 |
| 2 | Today Daily Change % | 0.74 |
| 3 | Today daily open | 131.33 |
The pair remains strongly bearish on the daily time frame. It trades below the 20 SMA @ 135.06, 50 SMA 132.53, 100 SMA @ 135.1 and 200 SMA @ 137.46.
| Trends | Trends.1 | |
|---|---|---|
| 0 | Daily SMA20 | 135.06 |
| 1 | Daily SMA50 | 132.53 |
| 2 | Daily SMA100 | 135.10 |
| 3 | Daily SMA200 | 137.46 |
The previous day high was 132.65 while the previous day low was 130.54. The daily 38.2% Fib levels comes at 131.34, expected to provide support. Similarly, the daily 61.8% fib level is at 131.84, expected to provide support.
Note the levels of interest below:
- Pivot support is noted at 130.36, 129.4, 128.25
- Pivot resistance is noted at 132.47, 133.61, 134.58
| Levels | Levels.1 |
|---|---|
| Previous Daily High | 132.65 |
| Previous Daily Low | 130.54 |
| Previous Weekly High | 135.12 |
| Previous Weekly Low | 131.56 |
| Previous Monthly High | 136.92 |
| Previous Monthly Low | 128.08 |
| Daily Fibonacci 38.2% | 131.34 |
| Daily Fibonacci 61.8% | 131.84 |
| Daily Pivot Point S1 | 130.36 |
| Daily Pivot Point S2 | 129.40 |
| Daily Pivot Point S3 | 128.25 |
| Daily Pivot Point R1 | 132.47 |
| Daily Pivot Point R2 | 133.61 |
| Daily Pivot Point R3 | 134.58 |
[/s2If]
Join Our Telegram Group
")


