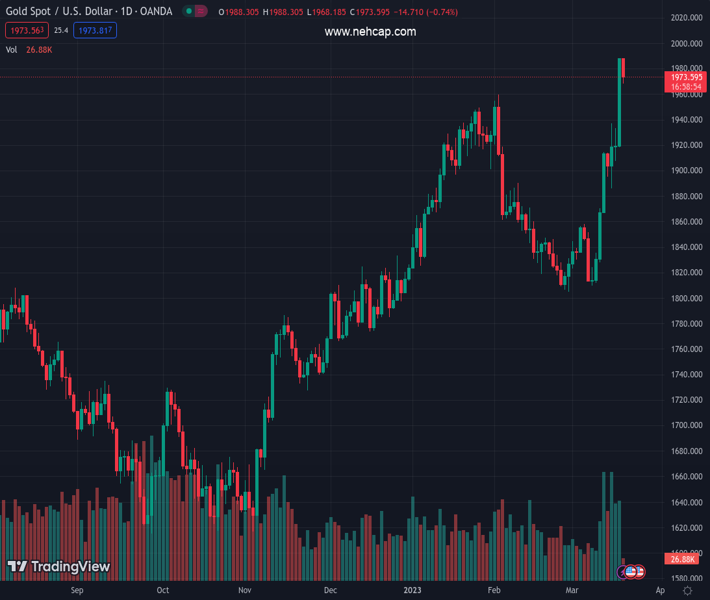
#XAUUSD @ 1,973.26 Gold price has corrected to near $1,970.00 as investors are getting anxious about the Fed policy. (Pivot Orderbook analysis)
…
This is a premium post.
[s2If !current_user_can(access_s2member_level4)]Please register for PREMIUM VERSION HERE to read full post below containing analysis. In case of any error or you think you are not able to read the full post below, please email us at support#nehcap.com [lwa][/s2If] [s2If current_user_can(access_s2member_level4)]
- Gold price has corrected to near $1,970.00 as investors are getting anxious about the Fed policy.
- Safe-haven appeal for Gold has been trimmed as UBS promised to rescue Credit Suisse.
- Gold bulls are experiencing a momentum loss and are expected to deliver a mean reversion to near the 20-EMA.
The pair currently trades last at 1973.26.
The previous day high was 1989.51 while the previous day low was 1918.31. The daily 38.2% Fib levels comes at 1962.31, expected to provide support. Similarly, the daily 61.8% fib level is at 1945.51, expected to provide support.
Gold price (XAU/USD) corrected to near $1,970.00 after UBS announced the Credit Suisse rescue plan. The precious metal is gauging a cushion around the $1,970.00 support, however, further correction looks possible.
Investors should be aware of the fact that the market participants were pumping funds into the yellow metal to safeguard themselves from the volatility associated with a potential banking fiasco. A buyout deal by UBS has trimmed fears of global banking turmoil. The buyout deal has sent a signal that central banks are prepared to provide assistance to commercial banks in order to retrieve the confidence of investors.
The US Dollar Index (DXY) is demonstrating a back-and-forth action around 103.80 as the market is preparing for the interest rate decision by the Federal Reserve (Fed), which is scheduled for Wednesday. Analysts at Danske Bank see Fed chair Jerome Powell raising rates by 25 basis points (bps) despite recent turmoil amid banking sector jitters.
Bulk morning gains generated by the S&P500 futures are halved now, portraying that the UBS-Credit Suisse deal is not sufficient enough to deal with the global banking jitters. Negative market sentiment would stay for a period of time as the banking mess is still to show true colors. Meanwhile, the UBS-Credit Suisse deal has trimmed demand for US government bonds, which were being considered as safe-haven. This has pushed the 10-year US Treasury yields higher to 3.46%.
Gold price delivered a stalwart rally after a breakout of the Symmetrical Triangle chart pattern on an hourly scale. A breakout in the aforementioned chart pattern is followed by heavy volume and wide ticks. After a perpendicular rally, Gold bulls are experiencing a momentum loss and are expected to deliver a mean-reversion to near the 20-period Exponential Moving Average (EMA) at $1,964.00.
The Relative Strength Index (RSI) (14) is oscillating in the bullish range of 60.00-80.00, which indicates that the upside momentum is extremely solid.
Technical Levels: Supports and Resistances
XAUUSD currently trading at 1973.78 at the time of writing. Pair opened at 1989.46 and is trading with a change of -0.79 % .
| Overview | Overview.1 | |
|---|---|---|
| 0 | Today last price | 1973.78 |
| 1 | Today Daily Change | -15.68 |
| 2 | Today Daily Change % | -0.79 |
| 3 | Today daily open | 1989.46 |
The pair remains strongly bullish on the daily timeframe. It trades above its 20 SMA @ 1856.42, 50 SMA 1879.63, 100 SMA @ 1824.16 and 200 SMA @ 1776.95.
| Trends | Trends.1 | |
|---|---|---|
| 0 | Daily SMA20 | 1856.42 |
| 1 | Daily SMA50 | 1879.63 |
| 2 | Daily SMA100 | 1824.16 |
| 3 | Daily SMA200 | 1776.95 |
The previous day high was 1989.51 while the previous day low was 1918.31. The daily 38.2% Fib levels comes at 1962.31, expected to provide support. Similarly, the daily 61.8% fib level is at 1945.51, expected to provide support.
Note the levels of interest below:
- Pivot support is noted at 1942.01, 1894.56, 1870.81
- Pivot resistance is noted at 2013.21, 2036.96, 2084.41
| Levels | Levels.1 |
|---|---|
| Previous Daily High | 1989.51 |
| Previous Daily Low | 1918.31 |
| Previous Weekly High | 1989.51 |
| Previous Weekly Low | 1867.66 |
| Previous Monthly High | 1959.80 |
| Previous Monthly Low | 1804.76 |
| Daily Fibonacci 38.2% | 1962.31 |
| Daily Fibonacci 61.8% | 1945.51 |
| Daily Pivot Point S1 | 1942.01 |
| Daily Pivot Point S2 | 1894.56 |
| Daily Pivot Point S3 | 1870.81 |
| Daily Pivot Point R1 | 2013.21 |
| Daily Pivot Point R2 | 2036.96 |
| Daily Pivot Point R3 | 2084.41 |
[/s2If]
Join Our Telegram Group
")


