#XAGUSD @ 22.302 Silver Price Analysis: reverses from six-week-old hurdle towards $22.00, @nehcap view: Further downside expected (Pivot Orderbook analysis)
…
This is a premium post.
[s2If !current_user_can(access_s2member_level4)]Please register for PREMIUM VERSION HERE to read full post below containing analysis. In case of any error or you think you are not able to read the full post below, please email us at support#nehcap.com [lwa][/s2If] [s2If current_user_can(access_s2member_level4)]
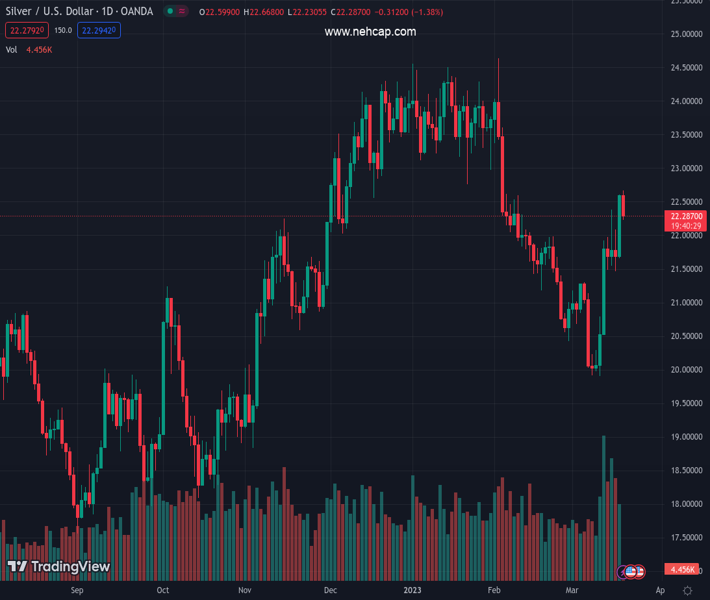
The pair currently trades last at 22.302.
The previous day high was 22.61 while the previous day low was 21.66. The daily 38.2% Fib levels comes at 22.25, expected to provide support. Similarly, the daily 61.8% fib level is at 22.03, expected to provide support.
Silver price (XAG/USD) takes offers to renew intraday low near $22.40 as it reverses from the highest levels since early February as the Fed week begins.
In doing so, the bright metal reverses from the horizontal area comprising multiple tops marked since February 03, around $22.60.
It’s worth noting that the overbought conditions of the RSI (14) also help the XAG/USD to pare recent gains near the multi-day high.
However, bullish MACD signals and the metal’s sustained trading above the key supports keep the Silver buyers hopeful.
Among the immediate crucial support is a one-week-old ascending trend line, around $21.90, as well as the 200-bar Exponential Moving Average (EMA) surrounding $21.65.
It should be observed that the early month swing high near $21.30 and the $21.00 round figure can act as additional downside filters for the XAG/USD bears to watch before targeting the monthly low of $19.90.
Meanwhile, the Silver price run-up beyond the aforementioned resistance line surrounding $22.60 needs validation from the 61.8% Fibonacci retracement level of the metal’s February-March downside, near $22.85.
Following that, a run-up toward the Year-To-Date (YTD) high surrounding $24.65 can’t be ruled out.
Overall, the Silver price is likely to decline but the bears have a long way to ride before retaking control.
Trend: Further downside expected
Technical Levels: Supports and Resistances
XAGUSD currently trading at 22.33 at the time of writing. Pair opened at 22.61 and is trading with a change of -1.24% % .
| Overview | Overview.1 | |
|---|---|---|
| 0 | Today last price | 22.33 |
| 1 | Today Daily Change | -0.28 |
| 2 | Today Daily Change % | -1.24% |
| 3 | Today daily open | 22.61 |
The pair is trading above its 20 Daily moving average @ 21.16, below its 50 Daily moving average @ 22.33 , above its 100 Daily moving average @ 22.32 and above its 200 Daily moving average @ 20.94
| Trends | Trends.1 | |
|---|---|---|
| 0 | Daily SMA20 | 21.16 |
| 1 | Daily SMA50 | 22.33 |
| 2 | Daily SMA100 | 22.32 |
| 3 | Daily SMA200 | 20.94 |
The previous day high was 22.61 while the previous day low was 21.66. The daily 38.2% Fib levels comes at 22.25, expected to provide support. Similarly, the daily 61.8% fib level is at 22.03, expected to provide support.
Note the levels of interest below:
- Pivot support is noted at 21.98, 21.35, 21.03
- Pivot resistance is noted at 22.92, 23.24, 23.87
| Levels | Levels.1 |
|---|---|
| Previous Daily High | 22.61 |
| Previous Daily Low | 21.66 |
| Previous Weekly High | 22.61 |
| Previous Weekly Low | 20.54 |
| Previous Monthly High | 24.64 |
| Previous Monthly Low | 20.42 |
| Daily Fibonacci 38.2% | 22.25 |
| Daily Fibonacci 61.8% | 22.03 |
| Daily Pivot Point S1 | 21.98 |
| Daily Pivot Point S2 | 21.35 |
| Daily Pivot Point S3 | 21.03 |
| Daily Pivot Point R1 | 22.92 |
| Daily Pivot Point R2 | 23.24 |
| Daily Pivot Point R3 | 23.87 |
[/s2If]
Join Our Telegram Group
")


