WTI slides below $67 as global banking turmoil overshadows central banks’ liquidity efforts. (Pivot Orderbook analysis)
…
This is a premium post.
[s2If !current_user_can(access_s2member_level4)]Please register for PREMIUM VERSION HERE to read full post below containing analysis. In case of any error or you think you are not able to read the full post below, please email us at support#nehcap.com [lwa][/s2If] [s2If current_user_can(access_s2member_level4)]
- WTI slides below $67 as global banking turmoil overshadows central banks’ liquidity efforts.
- OPEC in trouble as falling prices persist: Can coordination among oil-exporting nations stabilize the market?
- Oil prices could hit the $60 mark if the banking crisis continues to unfold.
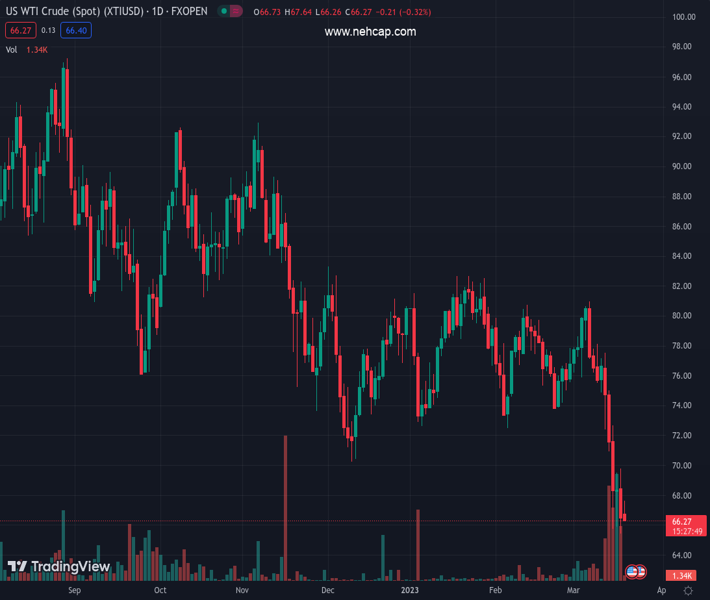
The pair currently trades last at 66.43.
The previous day high was 69.83 while the previous day low was 65.44. The daily 38.2% Fib levels comes at 67.12, expected to provide resistance. Similarly, the daily 61.8% fib level is at 68.15, expected to provide resistance.
West Texas Intermediate (WTI) price fell below the $67 mark despite reassurance from major central banks. A likely case of banking contagion is unfolding. Credit Suisse fell apart. Later on, UBS was urged to acquire the troubled bank.
WTI does not catch a break, and the heavy downfall suggests intense pessimism among investors, as oil prices often serve as a growth barometer.
During the weekend, the Federal Reserve (Fed) opened its swap line from Monday onward until April. It’s a channel through which other central banks obtain US Dollars on short-term maturity in exchange for local currency. Subsequently, this excess USD reserve is accessed by commercial banks to facilitate business operations.
Oil prices are reflecting global growth concerns amid adversity led by banking turmoil. Some reports suggest that two European commercial banks are under scrutiny for possible contagion.
On the Organization of the Petroleum Exporting Countries (OPEC) front, falling prices, despite all efforts from the said group, are causing trouble for OPEC. Earlier, some comments from Iraq’s Prime Minister Mohammed Shia al-Sudani and OPEC Secretary General Haitham Al Ghais stressed the need to coordinate among oil-exporting nations to ensure prices do not fluctuate and impact both exporter and consumer countries.
A continuous deterioration in the global banking sector could lead the WTI price to approach the $60 mark.
Technical Levels: Supports and Resistances
XTIUSD currently trading at 66.43 at the time of writing. Pair opened at 66.57 and is trading with a change of -0.21 % .
| Overview | Overview.1 | |
|---|---|---|
| 0 | Today last price | 66.43 |
| 1 | Today Daily Change | -0.14 |
| 2 | Today Daily Change % | -0.21 |
| 3 | Today daily open | 66.57 |
The pair remains strongly bearish on the daily time frame. It trades below the 20 SMA @ 75.24, 50 SMA 77.24, 100 SMA @ 78.59 and 200 SMA @ 85.58.
| Trends | Trends.1 | |
|---|---|---|
| 0 | Daily SMA20 | 75.24 |
| 1 | Daily SMA50 | 77.24 |
| 2 | Daily SMA100 | 78.59 |
| 3 | Daily SMA200 | 85.58 |
The previous day high was 69.83 while the previous day low was 65.44. The daily 38.2% Fib levels comes at 67.12, expected to provide resistance. Similarly, the daily 61.8% fib level is at 68.15, expected to provide resistance.
Note the levels of interest below:
- Pivot support is noted at 64.73, 62.89, 60.34
- Pivot resistance is noted at 69.12, 71.67, 73.5
| Levels | Levels.1 |
|---|---|
| Previous Daily High | 69.83 |
| Previous Daily Low | 65.44 |
| Previous Weekly High | 77.55 |
| Previous Weekly Low | 65.44 |
| Previous Monthly High | 80.75 |
| Previous Monthly Low | 72.50 |
| Daily Fibonacci 38.2% | 67.12 |
| Daily Fibonacci 61.8% | 68.15 |
| Daily Pivot Point S1 | 64.73 |
| Daily Pivot Point S2 | 62.89 |
| Daily Pivot Point S3 | 60.34 |
| Daily Pivot Point R1 | 69.12 |
| Daily Pivot Point R2 | 71.67 |
| Daily Pivot Point R3 | 73.50 |
[/s2If]
Join Our Telegram Group
")


