#USDMXN @ 18.9434 Price Analysis: Bulls attack key resistance line near 19.00, @nehcap view: Further upside expected (Pivot Orderbook analysis)
…
This is a premium post.
[s2If !current_user_can(access_s2member_level4)]Please register for PREMIUM VERSION HERE to read full post below containing analysis. In case of any error or you think you are not able to read the full post below, please email us at support#nehcap.com [lwa][/s2If] [s2If current_user_can(access_s2member_level4)]
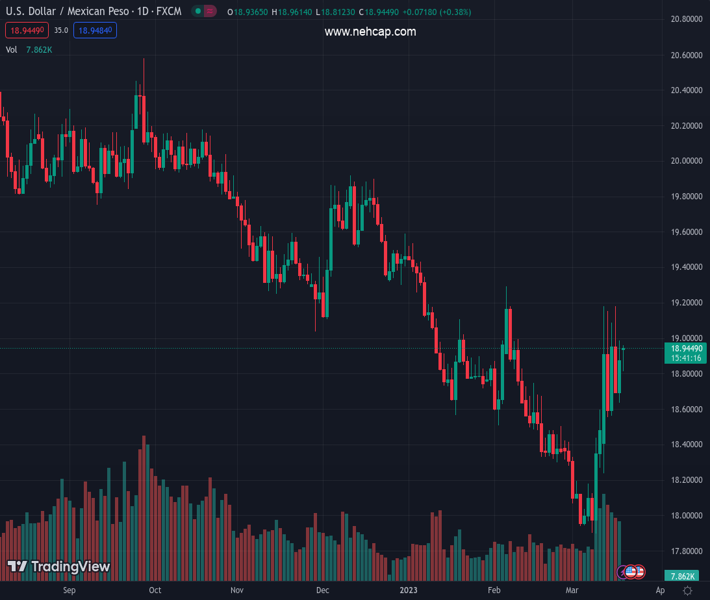
The pair currently trades last at 18.9434.
The previous day high was 18.989 while the previous day low was 18.636. The daily 38.2% Fib levels comes at 18.8541, expected to provide support. Similarly, the daily 61.8% fib level is at 18.7708, expected to provide support.
USD/MXN grinds near intraday high of 18.96 as bulls poke the key resistance line during early Monday. In doing so, the Mexican Peso (MXN) pair remains firmer for the second consecutive day while extending previous day’s rebound from the 50-DMA.
In addition to the pair’s recovery from the 50-DMA, bullish MACD signals and upbeat RSI (14), not overbought, also favor the USD/MXN pair buyers.
However, a clear upside break of the stated resistance line, near 19.00 at the latest, becomes necessary for the USD/MXN bulls to keep the reins.
Following that, the 61.8% Fibonacci retracement level of the pair’s downturn from December 2022 to March 2023, close to 19.15, will precede the double tops around 19.20 to challenge the buyers.
Furthermore, the previous monthly high surrounding 19.30 act as an extra filter towards the north.
On the contrary, pullback moves remain elusive unless the USD/MXN price remains beyond the 50-DMA support of near 18.60.
Even if the pair drops below 18.60, the late February swing high near 18.50 can act as a buffer ahead of directing the bears towards the multi-month low marked earlier in March near 17.90.
Overall, USD/MXN is likely to recovery but the road towards the north appears long and bumpy.
Trend: Further upside expected
Technical Levels: Supports and Resistances
USDMXN currently trading at 18.9452 at the time of writing. Pair opened at 18.9028 and is trading with a change of 0.22% % .
| Overview | Overview.1 | |
|---|---|---|
| 0 | Today last price | 18.9452 |
| 1 | Today Daily Change | 0.0424 |
| 2 | Today Daily Change % | 0.22% |
| 3 | Today daily open | 18.9028 |
The pair is trading above its 20 Daily moving average @ 18.3948, above its 50 Daily moving average @ 18.6337 , below its 100 Daily moving average @ 19.0703 and below its 200 Daily moving average @ 19.6246
| Trends | Trends.1 | |
|---|---|---|
| 0 | Daily SMA20 | 18.3948 |
| 1 | Daily SMA50 | 18.6337 |
| 2 | Daily SMA100 | 19.0703 |
| 3 | Daily SMA200 | 19.6246 |
The previous day high was 18.989 while the previous day low was 18.636. The daily 38.2% Fib levels comes at 18.8541, expected to provide support. Similarly, the daily 61.8% fib level is at 18.7708, expected to provide support.
Note the levels of interest below:
- Pivot support is noted at 18.6962, 18.4896, 18.3432
- Pivot resistance is noted at 19.0492, 19.1956, 19.4022
| Levels | Levels.1 |
|---|---|
| Previous Daily High | 18.9890 |
| Previous Daily Low | 18.6360 |
| Previous Weekly High | 19.1812 |
| Previous Weekly Low | 18.2397 |
| Previous Monthly High | 19.2901 |
| Previous Monthly Low | 18.2954 |
| Daily Fibonacci 38.2% | 18.8541 |
| Daily Fibonacci 61.8% | 18.7708 |
| Daily Pivot Point S1 | 18.6962 |
| Daily Pivot Point S2 | 18.4896 |
| Daily Pivot Point S3 | 18.3432 |
| Daily Pivot Point R1 | 19.0492 |
| Daily Pivot Point R2 | 19.1956 |
| Daily Pivot Point R3 | 19.4022 |
[/s2If]
Join Our Telegram Group
")


