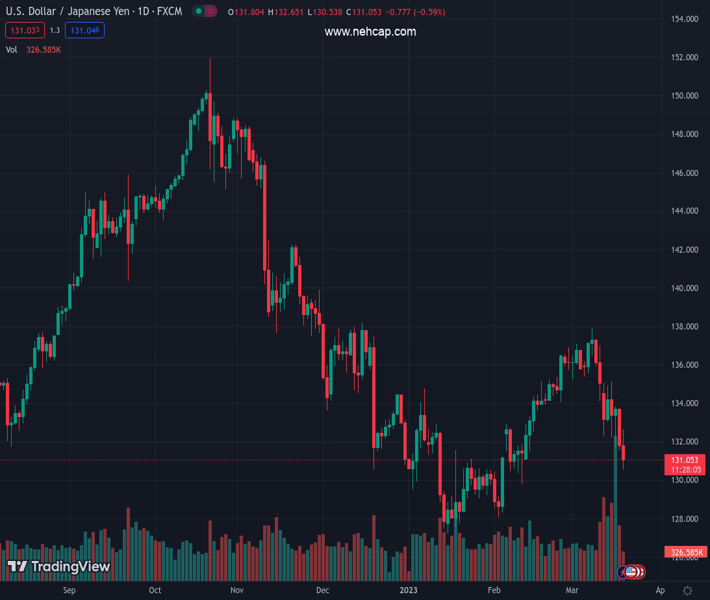
#USDJPY @ 130.937 comes under renewed selling on Monday and drops to its lowest level since February. (Pivot Orderbook analysis)
…
This is a premium post.
[s2If !current_user_can(access_s2member_level4)]Please register for PREMIUM VERSION HERE to read full post below containing analysis. In case of any error or you think you are not able to read the full post below, please email us at support#nehcap.com [lwa][/s2If] [s2If current_user_can(access_s2member_level4)]
- USD/JPY comes under renewed selling on Monday and drops to its lowest level since February.
- The prevalent risk-off environment boosts the safe-haven JPY and weighs heavily on the major.
- A modest USD strength lends some support, though the fundamental backdrop favour bears.
The pair currently trades last at 130.937.
The previous day high was 133.77 while the previous day low was 131.56. The daily 38.2% Fib levels comes at 132.4, expected to provide resistance. Similarly, the daily 61.8% fib level is at 132.92, expected to provide resistance.
The USD/JPY pair retreats over 200 pips from the daily swing high and drops to its lowest level since February 10 during the first half of the European session on Monday. Spot prices, however, manage to rebound a few pips in the last hour and currently trades around the 131.00 mark, still down over 0.60% for the day.
The prevalent risk-off environment – as reflected by an extended sell-off around the equity markets amid fears of a full-blown banking crisis – drives some haven flows towards the Japanese Yen (JPY) and weighs heavily on the USD/JPY pair. Despite the recent emergency liquidity measures and multi-billion-dollar lifelines for troubled US and European banks, market participants remain concerned about the contagion risk. This, along with looming recession risks, takes its toll on the global risk sentiment and forces investors to take refuge in traditional safe-haven assets.
That said, a modest US Dollar (USD) strength assists the USD/JPY pair to find some support ahead of the mid-130.00s and stall its sharp intraday downfall. The USD uptick, however, remains limited amid the ongoing slump in the US Treasury bond yields. The anti-risk flow, along with diminishing odds for a more aggressive policy tightening by the Fed, lead to a further steep fall in the US bond yields. This comes after the rate-sensitive 2-year US government bond last week recorded its biggest three-day fall since Black Monday in October 1987 and should cap the buck.
The aforementioned fundamental backdrop suggests that the path of least resistance for the USD/JPY pair is to the downside. That said, traders might refrain from placing fresh bearish bets and prefer to move to the sidelines ahead of the two-day FOMC meeting, starting this Tuesday. The Fed will announce its policy decision during the US session on Wednesday, which will play a key role in influencing the near-term USD price dynamics. This, in turn, should provide a fresh impetus to the USD/JPY pair and help investors to determine the next leg of a directional move.
Technical Levels: Supports and Resistances
USDJPY currently trading at 130.86 at the time of writing. Pair opened at 131.84 and is trading with a change of -0.74 % .
| Overview | Overview.1 | |
|---|---|---|
| 0 | Today last price | 130.86 |
| 1 | Today Daily Change | -0.98 |
| 2 | Today Daily Change % | -0.74 |
| 3 | Today daily open | 131.84 |
The pair remains strongly bearish on the daily time frame. It trades below the 20 SMA @ 135.2, 50 SMA 132.54, 100 SMA @ 135.28 and 200 SMA @ 137.48.
| Trends | Trends.1 | |
|---|---|---|
| 0 | Daily SMA20 | 135.20 |
| 1 | Daily SMA50 | 132.54 |
| 2 | Daily SMA100 | 135.28 |
| 3 | Daily SMA200 | 137.48 |
The previous day high was 133.77 while the previous day low was 131.56. The daily 38.2% Fib levels comes at 132.4, expected to provide resistance. Similarly, the daily 61.8% fib level is at 132.92, expected to provide resistance.
Note the levels of interest below:
- Pivot support is noted at 131.01, 130.18, 128.8
- Pivot resistance is noted at 133.22, 134.6, 135.43
| Levels | Levels.1 |
|---|---|
| Previous Daily High | 133.77 |
| Previous Daily Low | 131.56 |
| Previous Weekly High | 135.12 |
| Previous Weekly Low | 131.56 |
| Previous Monthly High | 136.92 |
| Previous Monthly Low | 128.08 |
| Daily Fibonacci 38.2% | 132.40 |
| Daily Fibonacci 61.8% | 132.92 |
| Daily Pivot Point S1 | 131.01 |
| Daily Pivot Point S2 | 130.18 |
| Daily Pivot Point S3 | 128.80 |
| Daily Pivot Point R1 | 133.22 |
| Daily Pivot Point R2 | 134.60 |
| Daily Pivot Point R3 | 135.43 |
[/s2If]
Join Our Telegram Group
")


