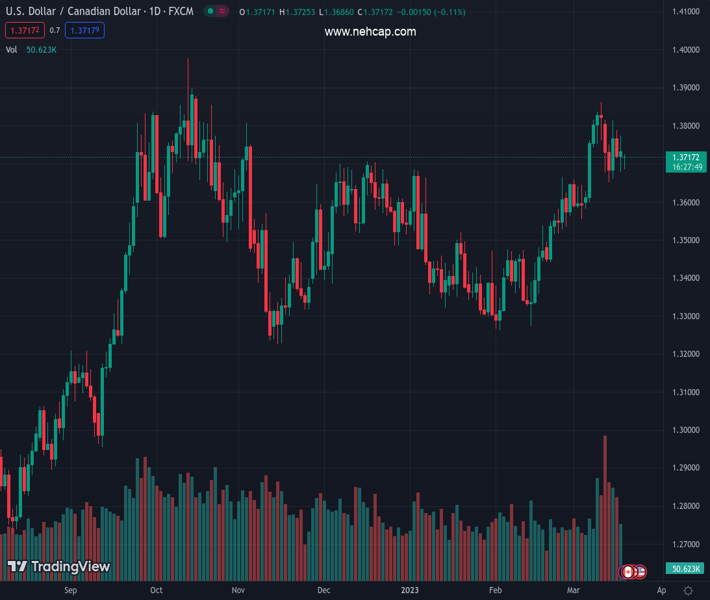
#USDCAD @ 1.37170 is hovering near day’s high around 1.3720 amid anxiety among investors as they await Fed policy. (Pivot Orderbook analysis)
…
This is a premium post.
[s2If !current_user_can(access_s2member_level4)]Please register for PREMIUM VERSION HERE to read full post below containing analysis. In case of any error or you think you are not able to read the full post below, please email us at support#nehcap.com [lwa][/s2If] [s2If current_user_can(access_s2member_level4)]
- USD/CAD is hovering near day’s high around 1.3720 amid anxiety among investors as they await Fed policy.
- US equities are facing severe heat led by deepening fears of global banking turmoil.
- Oil price has corrected to near $66.30 as the PBoC maintains the status quo.
The pair currently trades last at 1.37170.
The previous day high was 1.3773 while the previous day low was 1.3678. The daily 38.2% Fib levels comes at 1.3737, expected to provide resistance. Similarly, the daily 61.8% fib level is at 1.3714, expected to provide support.
The USD/CAD pair has printed a fresh intraday high at 1.3725 in the Asian session. The upside in the Loonie asset has been fueled by a recovery move from the US Dollar Index (DXY) and a corrective move in the oil price. Soaring anxiety among investors ahead of the interest rate decision by the Federal Reserve (Fed) is improving USD Index’s appeal.
The USD Index has recovered to 103.87 and is gathering strength to extend its recovery above the immediate resistance of 104.00. Meanwhile, S&P500 futures have surrendered the majority of their gains earned in the early Tokyo session. This portrays that the risk aversion theme is extremely solid and investors are using rallies for building more shorts.
US equities are facing severe heat led by deepening fears of global banking turmoil and anxiety among investors ahead of Fed policy. In a recent poll by Reuters, 76 of 82 economists believe that the US Federal Reserve (Fed) would raise its policy rate by 25 basis points (bps) to the range of 4.75-5% following the March Federal Open Market Committee (FOMC) meeting.
Meanwhile, the Canadian Dollar is dancing to the tunes of the inflation data, which will release on Tuesday. As per the consensus, the monthly headline Consumer Price Index (CPI) is expected to accelerate by 0.4%, lower than the former release of 0.5%. This might drag the annual headline CPI further to 5.5%. Also, the annual core CPI is expected to trim to 4.6% from the former release of 5.0%.
Investors should be aware of the fact that Bank of Canada (BoC) Governor Tiff Macklem has already held interest rates steady at 4.5%. BoC Macklem considers the current monetary policy as restrictive enough to scale down price pressures.
On the oil front, oil price has corrected to near $66.30 as the People’s Bank of China (PBoC) kept the interest rate policy unchanged. The street was anticipating an expansionary policy to infuse more liquidity into the economy. It is worth noting that Canada is a leading exporter of oil to the United States and lower the oil price might impact the Canadian Dollar further.
Technical Levels: Supports and Resistances
USDCAD currently trading at 1.372 at the time of writing. Pair opened at 1.3729 and is trading with a change of -0.07 % .
| Overview | Overview.1 | |
|---|---|---|
| 0 | Today last price | 1.3720 |
| 1 | Today Daily Change | -0.0009 |
| 2 | Today Daily Change % | -0.0700 |
| 3 | Today daily open | 1.3729 |
The pair remains strongly bullish on the daily timeframe. It trades above its 20 SMA @ 1.3658, 50 SMA 1.3497, 100 SMA @ 1.351 and 200 SMA @ 1.334.
| Trends | Trends.1 | |
|---|---|---|
| 0 | Daily SMA20 | 1.3658 |
| 1 | Daily SMA50 | 1.3497 |
| 2 | Daily SMA100 | 1.3510 |
| 3 | Daily SMA200 | 1.3340 |
The previous day high was 1.3773 while the previous day low was 1.3678. The daily 38.2% Fib levels comes at 1.3737, expected to provide resistance. Similarly, the daily 61.8% fib level is at 1.3714, expected to provide support.
Note the levels of interest below:
- Pivot support is noted at 1.368, 1.3631, 1.3585
- Pivot resistance is noted at 1.3776, 1.3822, 1.3872
| Levels | Levels.1 |
|---|---|
| Previous Daily High | 1.3773 |
| Previous Daily Low | 1.3678 |
| Previous Weekly High | 1.3828 |
| Previous Weekly Low | 1.3652 |
| Previous Monthly High | 1.3666 |
| Previous Monthly Low | 1.3262 |
| Daily Fibonacci 38.2% | 1.3737 |
| Daily Fibonacci 61.8% | 1.3714 |
| Daily Pivot Point S1 | 1.3680 |
| Daily Pivot Point S2 | 1.3631 |
| Daily Pivot Point S3 | 1.3585 |
| Daily Pivot Point R1 | 1.3776 |
| Daily Pivot Point R2 | 1.3822 |
| Daily Pivot Point R3 | 1.3872 |
[/s2If]
Join Our Telegram Group
")


