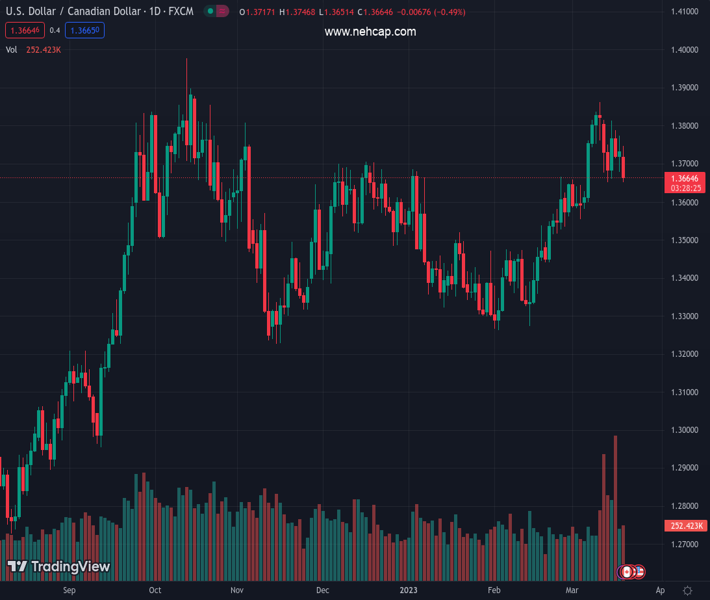
#USDCAD @ 1.36659 drops from weekly highs above 1.3700 on sentiment improvement. (Pivot Orderbook analysis)
…
This is a premium post.
[s2If !current_user_can(access_s2member_level4)]Please register for PREMIUM VERSION HERE to read full post below containing analysis. In case of any error or you think you are not able to read the full post below, please email us at support#nehcap.com [lwa][/s2If] [s2If current_user_can(access_s2member_level4)]
- USD/CAD drops from weekly highs above 1.3700 on sentiment improvement.
- The USD/CAD fall was capped by sellers unable to crack the 20-day EMA.
- USD/CAD Price Analysis: For a bearish resumption, the USD/CAD needs a daily close below 1.3661.
The pair currently trades last at 1.36659.
The previous day high was 1.3773 while the previous day low was 1.3678. The daily 38.2% Fib levels comes at 1.3737, expected to provide resistance. Similarly, the daily 61.8% fib level is at 1.3714, expected to provide resistance.
USD/CAD is erasing last Friday’s gains, hovering at around the 20-day Exponential Moving Average (EMA) at 1.3661 after hitting a daily high of 1.3746. A risk-on impulse on news that UBS bought Credit Suisse calmed tensions amidst turbulence in the banking system. Therefore, the USD/CAD exchanges hands at 1.3676, down 0.41%.
After peaking at 1.3862 ten days ago, the USD/CAD resumed its downtrend amidst overall US Dollar (USD) weakness. However, it should be said that the 20-day EMA has acted as a solid support, so for a bearish resumption, the USD/CAD must register a daily close below 1.3661.
Oscillators portray sellers gathering momentum, though the Relative Strength Index (RSI) needs to punch below the 50-midline, to further confirm a bearish continuation. Contrarily, the Rate of Change (RoC) indicates selling pressure increased. Therefore, the USD/CAD might test lower prices in the near term.
The USD/CAD first support would be the 20-day EMA at 1.3661, followed by the March 14 low at 1.3651. Break below, and the USD/CAD could tumble to 1.3600 before testing the 50-day EMA at 1.3570. Once cleared, the 100-day EMA at around 1.3500 would be challenged.
On the flip side, the USD/CAD first resistance would be the 1.3700 figure. A breach of the latter will expose the daily high at 1.3746, followed by 1.3800 and the last week’s high at 1.3814.
Technical Levels: Supports and Resistances
USDCAD currently trading at 1.3675 at the time of writing. Pair opened at 1.3729 and is trading with a change of -0.39 % .
| Overview | Overview.1 | |
|---|---|---|
| 0 | Today last price | 1.3675 |
| 1 | Today Daily Change | -0.0054 |
| 2 | Today Daily Change % | -0.3900 |
| 3 | Today daily open | 1.3729 |
The pair remains strongly bullish on the daily timeframe. It trades above its 20 SMA @ 1.3658, 50 SMA 1.3497, 100 SMA @ 1.351 and 200 SMA @ 1.334.
| Trends | Trends.1 | |
|---|---|---|
| 0 | Daily SMA20 | 1.3658 |
| 1 | Daily SMA50 | 1.3497 |
| 2 | Daily SMA100 | 1.3510 |
| 3 | Daily SMA200 | 1.3340 |
The previous day high was 1.3773 while the previous day low was 1.3678. The daily 38.2% Fib levels comes at 1.3737, expected to provide resistance. Similarly, the daily 61.8% fib level is at 1.3714, expected to provide resistance.
Note the levels of interest below:
- Pivot support is noted at 1.368, 1.3631, 1.3585
- Pivot resistance is noted at 1.3776, 1.3822, 1.3872
| Levels | Levels.1 |
|---|---|
| Previous Daily High | 1.3773 |
| Previous Daily Low | 1.3678 |
| Previous Weekly High | 1.3828 |
| Previous Weekly Low | 1.3652 |
| Previous Monthly High | 1.3666 |
| Previous Monthly Low | 1.3262 |
| Daily Fibonacci 38.2% | 1.3737 |
| Daily Fibonacci 61.8% | 1.3714 |
| Daily Pivot Point S1 | 1.3680 |
| Daily Pivot Point S2 | 1.3631 |
| Daily Pivot Point S3 | 1.3585 |
| Daily Pivot Point R1 | 1.3776 |
| Daily Pivot Point R2 | 1.3822 |
| Daily Pivot Point R3 | 1.3872 |
[/s2If]
Join Our Telegram Group
")


