#NZDUSD @ 0.62531 Price Analysis: Drops back towards 200-EMA around 0.6250, buyers stay hopeful, @nehcap view: Further upside expected (Pivot Orderbook analysis)
…
This is a premium post.
[s2If !current_user_can(access_s2member_level4)]Please register for PREMIUM VERSION HERE to read full post below containing analysis. In case of any error or you think you are not able to read the full post below, please email us at support#nehcap.com [lwa][/s2If] [s2If current_user_can(access_s2member_level4)]
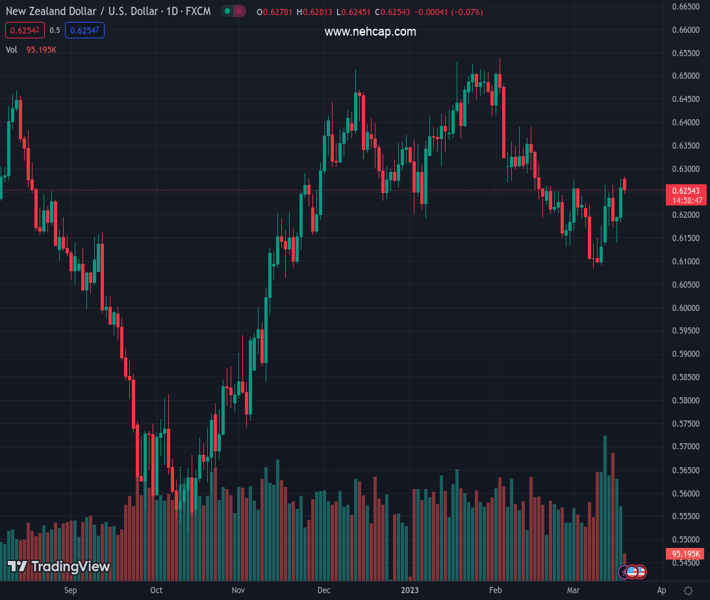
The pair currently trades last at 0.62531.
The previous day high was 0.6278 while the previous day low was 0.6178. The daily 38.2% Fib levels comes at 0.624, expected to provide support. Similarly, the daily 61.8% fib level is at 0.6216, expected to provide support.
NZD/USD prints the first daily loss in three as bears flirt with the 0.6250 level heading into Monday’s European session. In doing so, the Kiwi pair reverses from an upward-sloping resistance line from late February while dropping toward the 200-bar Exponential Moving Average (EMA).
Even if the one-month-long ascending trend line resistance challenges NZD/USD bulls near 0.6285, the pair’s sustained trading beyond the key EMA joins the bullish MACD signals to keep buyers hopeful.
That said, a one-week-old upward-sloping support line, close to 0.6175 at the latest, also restricts the short-term downside of the NZD/USD pair, in addition to the 200-EMA level surrounding 0.6240.
In a case where the Kiwi pair drops below 0.6175, the odds of witnessing a slump toward the monthly low near 0.6085 can’t be ruled out.
On the flip side, a clear upside break of the stated resistance line, near 0.6285 at the latest, will need validation from the 0.6300 round figure to propel the quote towards the tops marked during early February near 0.6390.
Following that, a run-up toward the Year-To-Date (YTD) high of nearly 0.6540 can’t be ruled out.
To sum up, NZD/USD remains on the bull’s radar despite the latest failure to cross the short-term resistance line.
Trend: Further upside expected
Technical Levels: Supports and Resistances
NZDUSD currently trading at 0.625 at the time of writing. Pair opened at 0.6269 and is trading with a change of -0.30% % .
| Overview | Overview.1 | |
|---|---|---|
| 0 | Today last price | 0.625 |
| 1 | Today Daily Change | -0.0019 |
| 2 | Today Daily Change % | -0.30% |
| 3 | Today daily open | 0.6269 |
The pair is trading above its 20 Daily moving average @ 0.6194, below its 50 Daily moving average @ 0.6313 , below its 100 Daily moving average @ 0.6263 and above its 200 Daily moving average @ 0.6162
| Trends | Trends.1 | |
|---|---|---|
| 0 | Daily SMA20 | 0.6194 |
| 1 | Daily SMA50 | 0.6313 |
| 2 | Daily SMA100 | 0.6263 |
| 3 | Daily SMA200 | 0.6162 |
The previous day high was 0.6278 while the previous day low was 0.6178. The daily 38.2% Fib levels comes at 0.624, expected to provide support. Similarly, the daily 61.8% fib level is at 0.6216, expected to provide support.
Note the levels of interest below:
- Pivot support is noted at 0.6205, 0.6141, 0.6105
- Pivot resistance is noted at 0.6305, 0.6342, 0.6406
| Levels | Levels.1 |
|---|---|
| Previous Daily High | 0.6278 |
| Previous Daily Low | 0.6178 |
| Previous Weekly High | 0.6278 |
| Previous Weekly Low | 0.6131 |
| Previous Monthly High | 0.6538 |
| Previous Monthly Low | 0.6131 |
| Daily Fibonacci 38.2% | 0.6240 |
| Daily Fibonacci 61.8% | 0.6216 |
| Daily Pivot Point S1 | 0.6205 |
| Daily Pivot Point S2 | 0.6141 |
| Daily Pivot Point S3 | 0.6105 |
| Daily Pivot Point R1 | 0.6305 |
| Daily Pivot Point R2 | 0.6342 |
| Daily Pivot Point R3 | 0.6406 |
[/s2If]
Join Our Telegram Group
")


