#GBPUSD @ 1.21823 Price Analysis: Bulls step back from multi-day-old hurdle near 1.2210, @nehcap view: Pullback expected (Pivot Orderbook analysis)
…
This is a premium post.
[s2If !current_user_can(access_s2member_level4)]Please register for PREMIUM VERSION HERE to read full post below containing analysis. In case of any error or you think you are not able to read the full post below, please email us at support#nehcap.com [lwa][/s2If] [s2If current_user_can(access_s2member_level4)]
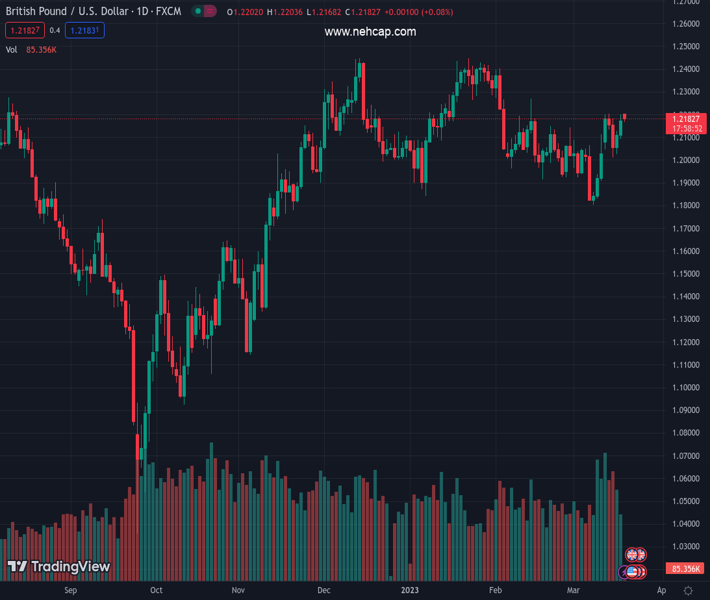
The pair currently trades last at 1.21823.
The previous day high was 1.2201 while the previous day low was 1.21. The daily 38.2% Fib levels comes at 1.2162, expected to provide support. Similarly, the daily 61.8% fib level is at 1.2138, expected to provide support.
GBP/USD bulls take a breather around a five-week high, recently declining to 1.2185 as it reverses from the key resistance line during early Monday. Even so, the Cable pair remains mildly bid while printing a three-day winning streak.
That said, a downward-sloping resistance line from late January, around 1.2210 by the press time, appears a tough nut to crack for the GBP/USD pair buyers amid nearly overbought RSI (14) and mildly bullish MACD signals.
Also acting as an upside hurdle is the 61.8% Fibonacci retracement level of the quote’s fall from late January to early March, around the 1.2200 round figure.
It should be noted that the mid-February top surrounding 1.2270 appears the last defense of the GBP/USD bears, a break of which could propel the Cable price towards the 2023 top marked in January around 1.2450.
On the flip side, the 50% Fibonacci retracement level of 1.2125 could lure intraday sellers of the GBP/USD pair but a convergence of the 50-EMA and one-week-old ascending support line, near 1.2085, appears a tough nut to crack for the bears to retake control.
Also acting as an important support is the 100-EMA level surrounding 1.2060, a break of which won’t hesitate to challenge multiple lows marked during late February, around 1.1930-20.
Overall, GBP/USD is likely to witness a pullback but the bears are far from retaking control.
Trend: Pullback expected
Technical Levels: Supports and Resistances
GBPUSD currently trading at 1.2187 at the time of writing. Pair opened at 1.2175 and is trading with a change of 0.10% % .
| Overview | Overview.1 | |
|---|---|---|
| 0 | Today last price | 1.2187 |
| 1 | Today Daily Change | 0.0012 |
| 2 | Today Daily Change % | 0.10% |
| 3 | Today daily open | 1.2175 |
The pair remains strongly bullish on the daily timeframe. It trades above its 20 SMA @ 1.2029, 50 SMA 1.2141, 100 SMA @ 1.2049 and 200 SMA @ 1.1892.
| Trends | Trends.1 | |
|---|---|---|
| 0 | Daily SMA20 | 1.2029 |
| 1 | Daily SMA50 | 1.2141 |
| 2 | Daily SMA100 | 1.2049 |
| 3 | Daily SMA200 | 1.1892 |
The previous day high was 1.2201 while the previous day low was 1.21. The daily 38.2% Fib levels comes at 1.2162, expected to provide support. Similarly, the daily 61.8% fib level is at 1.2138, expected to provide support.
Note the levels of interest below:
- Pivot support is noted at 1.2116, 1.2058, 1.2015
- Pivot resistance is noted at 1.2217, 1.2259, 1.2318
| Levels | Levels.1 |
|---|---|
| Previous Daily High | 1.2201 |
| Previous Daily Low | 1.2100 |
| Previous Weekly High | 1.2204 |
| Previous Weekly Low | 1.2010 |
| Previous Monthly High | 1.2402 |
| Previous Monthly Low | 1.1915 |
| Daily Fibonacci 38.2% | 1.2162 |
| Daily Fibonacci 61.8% | 1.2138 |
| Daily Pivot Point S1 | 1.2116 |
| Daily Pivot Point S2 | 1.2058 |
| Daily Pivot Point S3 | 1.2015 |
| Daily Pivot Point R1 | 1.2217 |
| Daily Pivot Point R2 | 1.2259 |
| Daily Pivot Point R3 | 1.2318 |
[/s2If]
Join Our Telegram Group
")


