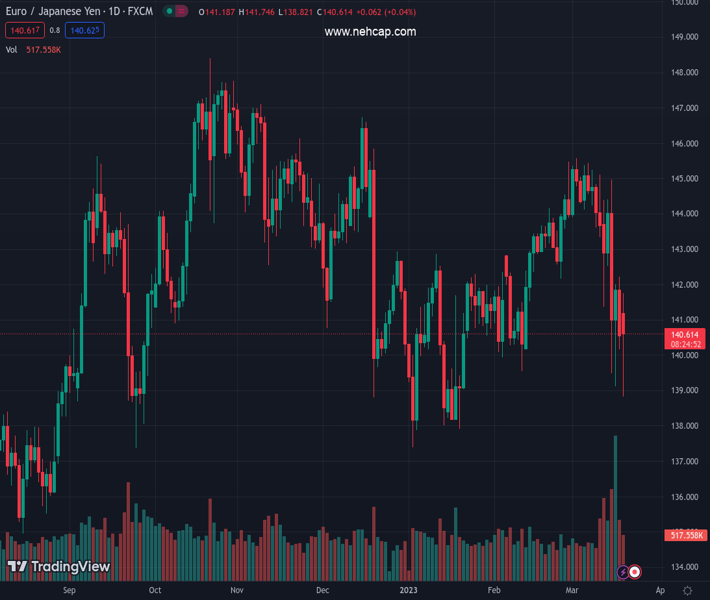
#EURJPY @ 140.577 adds to Friday’s downtick and breaches 139.00. (Pivot Orderbook analysis)
…
This is a premium post.
[s2If !current_user_can(access_s2member_level4)]Please register for PREMIUM VERSION HERE to read full post below containing analysis. In case of any error or you think you are not able to read the full post below, please email us at support#nehcap.com [lwa][/s2If] [s2If current_user_can(access_s2member_level4)]
- EUR/JPY adds to Friday’s downtick and breaches 139.00.
- Further losses appear likely below the 200-day SMA.
The pair currently trades last at 140.577.
The previous day high was 142.22 while the previous day low was 140.16. The daily 38.2% Fib levels comes at 140.95, expected to provide resistance. Similarly, the daily 61.8% fib level is at 141.43, expected to provide resistance.
EUR/JPY extends the downtrend to fresh lows in the sub-139.00 zone at the beginning of the week.
The cross remains under pressure and the door now seems open to the continuation of the downtrend for the time being. Against that, the immediate contention emerges at the weekly low at 137.91 (January 19) prior to the 2023 low at 137.38 (January 3).
In the meantime, extra losses remain on the cards while the cross trades below the 200-day SMA, today at 141.77.
Technical Levels: Supports and Resistances
EURJPY currently trading at 140.46 at the time of writing. Pair opened at 140.67 and is trading with a change of -0.15 % .
| Overview | Overview.1 | |
|---|---|---|
| 0 | Today last price | 140.46 |
| 1 | Today Daily Change | 292.00 |
| 2 | Today Daily Change % | -0.15 |
| 3 | Today daily open | 140.67 |
The pair remains strongly bearish on the daily time frame. It trades below the 20 SMA @ 143.63, 50 SMA 142.16, 100 SMA @ 142.86 and 200 SMA @ 141.8.
| Trends | Trends.1 | |
|---|---|---|
| 0 | Daily SMA20 | 143.63 |
| 1 | Daily SMA50 | 142.16 |
| 2 | Daily SMA100 | 142.86 |
| 3 | Daily SMA200 | 141.80 |
The previous day high was 142.22 while the previous day low was 140.16. The daily 38.2% Fib levels comes at 140.95, expected to provide resistance. Similarly, the daily 61.8% fib level is at 141.43, expected to provide resistance.
Note the levels of interest below:
- Pivot support is noted at 139.81, 138.96, 137.76
- Pivot resistance is noted at 141.87, 143.07, 143.93
| Levels | Levels.1 |
|---|---|
| Previous Daily High | 142.22 |
| Previous Daily Low | 140.16 |
| Previous Weekly High | 144.96 |
| Previous Weekly Low | 139.13 |
| Previous Monthly High | 145.47 |
| Previous Monthly Low | 139.55 |
| Daily Fibonacci 38.2% | 140.95 |
| Daily Fibonacci 61.8% | 141.43 |
| Daily Pivot Point S1 | 139.81 |
| Daily Pivot Point S2 | 138.96 |
| Daily Pivot Point S3 | 137.76 |
| Daily Pivot Point R1 | 141.87 |
| Daily Pivot Point R2 | 143.07 |
| Daily Pivot Point R3 | 143.93 |
[/s2If]
Join Our Telegram Group
")


