WTI bears are in the market as the countdown to NFP is underway. (Pivot Orderbook analysis)
…
This is a premium post.
[s2If !current_user_can(access_s2member_level4)]Please register for PREMIUM VERSION HERE to read full post below containing analysis. In case of any error or you think you are not able to read the full post below, please email us at support#nehcap.com [lwa][/s2If] [s2If current_user_can(access_s2member_level4)]
- WTI bears are in the market as the countdown to NFP is underway.
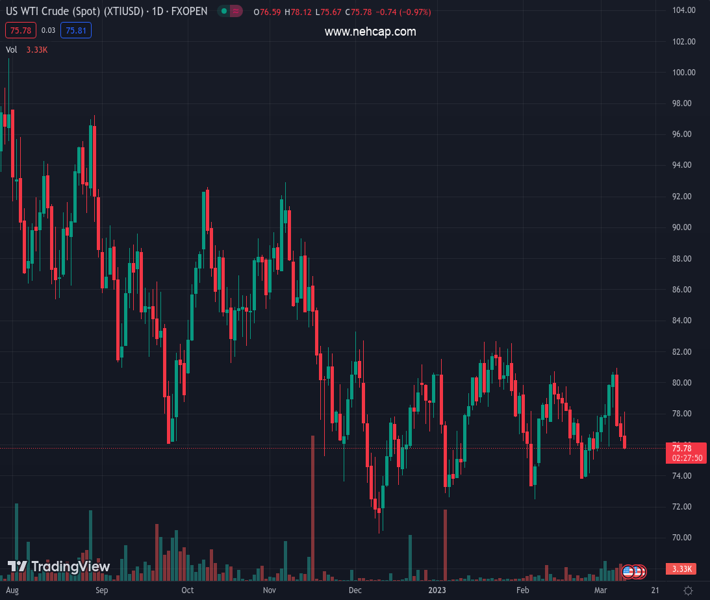
- WTI dropped around 1% on the third day of losses.
The pair currently trades last at 75.72.
The previous day high was 77.83 while the previous day low was 76.22. The daily 38.2% Fib levels comes at 76.84, expected to provide resistance. Similarly, the daily 61.8% fib level is at 77.22, expected to provide resistance.
West Texas Intermediate is down by some 1% on the day in late Wall Street trade. The black gold fell from a high of $78.01bbls to a low of $75.63 despite a softer US Dollar ahead of Friday’s main event for the week in the US Nonfarm Payrolls.
The US Dollar index was last seen down 0.4 points to 105.17 yet oil remains heavily offered. ”Trend signals in WTI crude have been bolstered by Chair Powell’s hawkish rhetoric during his Congressional testimony. With downside momentum signals firing on all cylinders, CTAs have bolstered sufficient dry-powder to raise the risk of yet another round of short covering,” analysts at TD Securities argued. ”This has been typical behavior over the last few months, in line with range-bound price action in energy markets.”
Oil is also pressured this week due to recession worries as the Federal Reserve turned hawkish. A series of data releases have been showing the US economy continues to run hot. However, data released on Thursday took some of the sting out of Fed Chairman Jerome Powell’s hawkish tone.
US jobless claims leaped by 11% last week. This was the heaviest move up in five months. Planned layoffs for February quadrupled year-on-year. This data might be indicating that the Federal Reserve’s hiking cycle has been playing out as intended and negates the need to hike aggressively. Consequently, all three major US stock indexes were up and the US Dollar has drifted lower in a correction from a three-month high near 105.90 printed at the start of the week.
Next up, Friday’s Nonfarm Payrolls and next week’s Consumer Price Index will be instrumental in guiding market expectations regarding the policy guidance likely to be offered by the FOMC at the March meeting.
”We look for payroll gains to mean-revert to 230k in February following the gangbuster report that saw job creation surge to 517k in January,” analysts at TD Securities said. ”We also expect the Unemployment Rate to remain unchanged at a historically low level; while average hourly earnings likely accelerated to a 0.4% m/m gain, lifting the YoY measure to a still-elevated 4.8%.” The analysts added, ”we think the hurdle is rather high to see USD weakness prevail; data would have to materially surprise to the downside.”
Technical Levels: Supports and Resistances
XTIUSD currently trading at 75.72 at the time of writing. Pair opened at 76.6 and is trading with a change of -1.15 % .
| Overview | Overview.1 | |
|---|---|---|
| 0 | Today last price | 75.72 |
| 1 | Today Daily Change | -0.88 |
| 2 | Today Daily Change % | -1.15 |
| 3 | Today daily open | 76.60 |
The pair remains strongly bearish on the daily time frame. It trades below the 20 SMA @ 77.66, 50 SMA 77.96, 100 SMA @ 79.6 and 200 SMA @ 87.21.
| Trends | Trends.1 | |
|---|---|---|
| 0 | Daily SMA20 | 77.66 |
| 1 | Daily SMA50 | 77.96 |
| 2 | Daily SMA100 | 79.60 |
| 3 | Daily SMA200 | 87.21 |
The previous day high was 77.83 while the previous day low was 76.22. The daily 38.2% Fib levels comes at 76.84, expected to provide resistance. Similarly, the daily 61.8% fib level is at 77.22, expected to provide resistance.
Note the levels of interest below:
- Pivot support is noted at 75.93, 75.27, 74.32
- Pivot resistance is noted at 77.55, 78.5, 79.16
| Levels | Levels.1 |
|---|---|
| Previous Daily High | 77.83 |
| Previous Daily Low | 76.22 |
| Previous Weekly High | 79.93 |
| Previous Weekly Low | 75.05 |
| Previous Monthly High | 80.75 |
| Previous Monthly Low | 72.50 |
| Daily Fibonacci 38.2% | 76.84 |
| Daily Fibonacci 61.8% | 77.22 |
| Daily Pivot Point S1 | 75.93 |
| Daily Pivot Point S2 | 75.27 |
| Daily Pivot Point S3 | 74.32 |
| Daily Pivot Point R1 | 77.55 |
| Daily Pivot Point R2 | 78.50 |
| Daily Pivot Point R3 | 79.16 |
[/s2If]
Join Our Telegram Group
")


