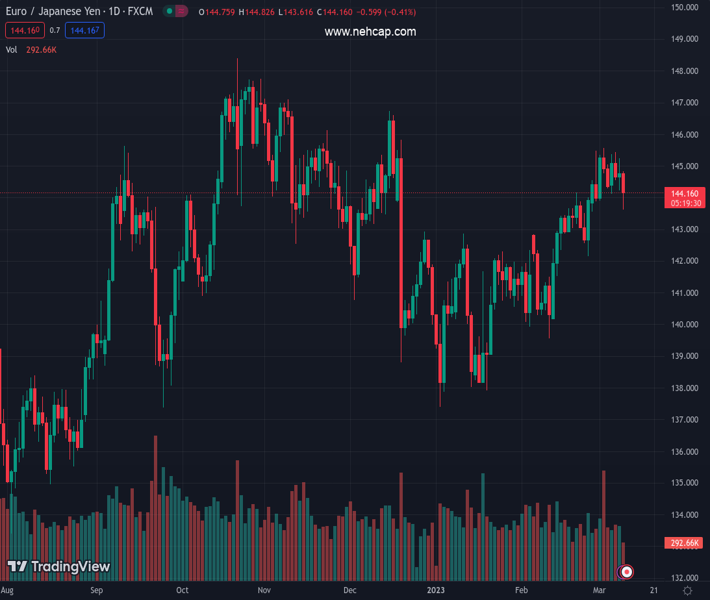
#EURJPY @ 144.126 accelerate losses and drops to the sub-144.00 region. (Pivot Orderbook analysis)
…
This is a premium post.
[s2If !current_user_can(access_s2member_level4)]Please register for PREMIUM VERSION HERE to read full post below containing analysis. In case of any error or you think you are not able to read the full post below, please email us at support#nehcap.com [lwa][/s2If] [s2If current_user_can(access_s2member_level4)]
- EUR/JPY accelerate losses and drops to the sub-144.00 region.
- There is an interim support at the 100-day SMA just above 143.00.
The pair currently trades last at 144.126.
The previous day high was 145.24 while the previous day low was 144.24. The daily 38.2% Fib levels comes at 144.85, expected to provide resistance. Similarly, the daily 61.8% fib level is at 144.62, expected to provide resistance.
EUR/JPY fades Wednesday’s small advance and drops to new multi-day lows below the 144.00 level on Thursday.
While further side-lined trading seems likely for the time being, the cross could face bouts of selling pressure and confront the provisional 100-day SMA at 143.09. The loss of the latter could spark a deeper move to the weekly low at 142.14 (February 24).
In the meantime, while above the 200-day SMA, today at 141.75, the outlook for the cross is expected to remain positive.
Technical Levels: Supports and Resistances
EURJPY currently trading at 144.02 at the time of writing. Pair opened at 144.76 and is trading with a change of -0.51 % .
| Overview | Overview.1 | |
|---|---|---|
| 0 | Today last price | 144.02 |
| 1 | Today Daily Change | 109.00 |
| 2 | Today Daily Change % | -0.51 |
| 3 | Today daily open | 144.76 |
The pair remains strongly bullish on the daily timeframe. It trades above its 20 SMA @ 143.54, 50 SMA 141.84, 100 SMA @ 143.16 and 200 SMA @ 141.77.
| Trends | Trends.1 | |
|---|---|---|
| 0 | Daily SMA20 | 143.54 |
| 1 | Daily SMA50 | 141.84 |
| 2 | Daily SMA100 | 143.16 |
| 3 | Daily SMA200 | 141.77 |
The previous day high was 145.24 while the previous day low was 144.24. The daily 38.2% Fib levels comes at 144.85, expected to provide resistance. Similarly, the daily 61.8% fib level is at 144.62, expected to provide resistance.
Note the levels of interest below:
- Pivot support is noted at 144.26, 143.75, 143.26
- Pivot resistance is noted at 145.25, 145.74, 146.25
| Levels | Levels.1 |
|---|---|
| Previous Daily High | 145.24 |
| Previous Daily Low | 144.24 |
| Previous Weekly High | 145.57 |
| Previous Weekly Low | 143.57 |
| Previous Monthly High | 145.47 |
| Previous Monthly Low | 139.55 |
| Daily Fibonacci 38.2% | 144.85 |
| Daily Fibonacci 61.8% | 144.62 |
| Daily Pivot Point S1 | 144.26 |
| Daily Pivot Point S2 | 143.75 |
| Daily Pivot Point S3 | 143.26 |
| Daily Pivot Point R1 | 145.25 |
| Daily Pivot Point R2 | 145.74 |
| Daily Pivot Point R3 | 146.25 |
[/s2If]
Join Our Telegram Group
")


