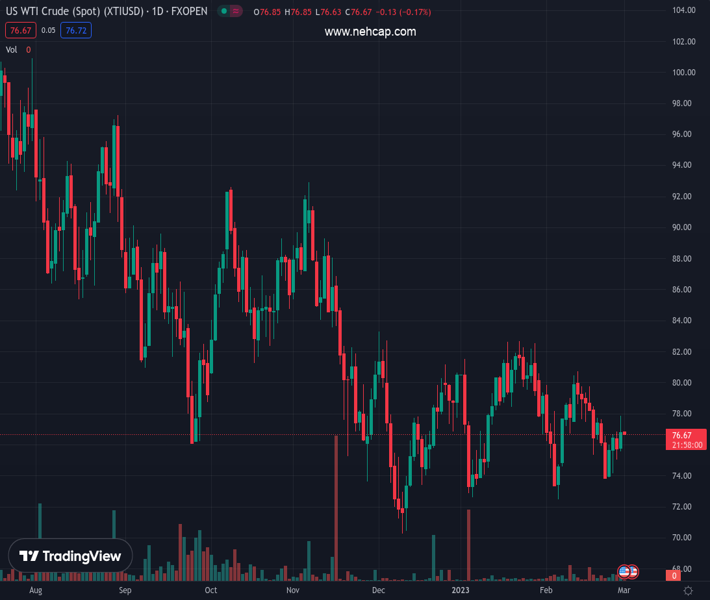
The oil price has extended its correction to near $76.60 amid anxiety among investors ahead of Caixin Manufacturing PMI. (Pivot Orderbook analysis)
…
This is a premium post.
[s2If !current_user_can(access_s2member_level4)]Please register for PREMIUM VERSION HERE to read full post below containing analysis. In case of any error or you think you are not able to read the full post below, please email us at support#nehcap.com [lwa][/s2If] [s2If current_user_can(access_s2member_level4)]
- The oil price has extended its correction to near $76.60 amid anxiety among investors ahead of Caixin Manufacturing PMI.
- Rising bets for a sheer economic recovery in China after the rollback of lockdown curbs are supporting an upside in PMI figures.
- A build-up of oil inventories by oil inventories at 6.20 million barrels, reported US API, is indicating weak demand.
The pair currently trades last at 76.74.
The previous day high was 76.85 while the previous day low was 75.05. The daily 38.2% Fib levels comes at 75.74, expected to provide support. Similarly, the daily 61.8% fib level is at 76.16, expected to provide support.
West Texas Intermediate (WTI), futures on NYMEX, have corrected firmly after facing firmer barricades above $77.50 in the late New York session. The oil price has dropped $76.60 and is expected to remain on the tenterhooks as investors are awaiting the release of the Caixin Manufacturing PMI data for fresh impetus.
There is no denying the fact that global institutions and investment banking firms are gung-ho for solid economic recovery in China after its administration dismantled pandemic controls post a three-year lockdown period. China’s post-pandemic era is expected to be resilient as the People’s Bank of China (PBoC) has promised a sheer revival in domestic demand through expansionary monetary policy.
Investors were surprised by weak January’s Caixin Manufacturing PMI data and are now anxious for February figures as a continuation of a downbeat spell will spoil the market mood. Broadly, the market sentiment is still risk averse as investors are anticipating a gloomy outlook due to hawkish Western central banks. And, now weak China’s Manufacturing PMI will worsen investors’ risk appetite further.
According to the consensus, IHS Markit will report Caixin Manufacturing PMI at 50.2, higher than the prior release of 49.2.
Apart from the Caixin Manufacturing PMI, the oil inventory report by the United States Energy Information Administration (EIA) for the week ending February 24 will be keenly watched.
On Tuesday, the US American Petroleum reported a huge pile of oil inventories at 6.20 million barrels but lower than the prior release of nearly 10 million barrels. Oil stockpiles are continuously rising for the past three months, indicating a sheer decline in the overall demand.
Technical Levels: Supports and Resistances
XTIUSD currently trading at 76.74 at the time of writing. Pair opened at 75.72 and is trading with a change of 1.35 % .
| Overview | Overview.1 | |
|---|---|---|
| 0 | Today last price | 76.74 |
| 1 | Today Daily Change | 1.02 |
| 2 | Today Daily Change % | 1.35 |
| 3 | Today daily open | 75.72 |
The pair remains strongly bearish on the daily time frame. It trades below the 20 SMA @ 77.11, 50 SMA 78.02, 100 SMA @ 80.11 and 200 SMA @ 88.43.
| Trends | Trends.1 | |
|---|---|---|
| 0 | Daily SMA20 | 77.11 |
| 1 | Daily SMA50 | 78.02 |
| 2 | Daily SMA100 | 80.11 |
| 3 | Daily SMA200 | 88.43 |
The previous day high was 76.85 while the previous day low was 75.05. The daily 38.2% Fib levels comes at 75.74, expected to provide support. Similarly, the daily 61.8% fib level is at 76.16, expected to provide support.
Note the levels of interest below:
- Pivot support is noted at 74.9, 74.07, 73.09
- Pivot resistance is noted at 76.7, 77.68, 78.51
| Levels | Levels.1 |
|---|---|
| Previous Daily High | 76.85 |
| Previous Daily Low | 75.05 |
| Previous Weekly High | 77.75 |
| Previous Weekly Low | 73.86 |
| Previous Monthly High | 82.68 |
| Previous Monthly Low | 72.64 |
| Daily Fibonacci 38.2% | 75.74 |
| Daily Fibonacci 61.8% | 76.16 |
| Daily Pivot Point S1 | 74.90 |
| Daily Pivot Point S2 | 74.07 |
| Daily Pivot Point S3 | 73.09 |
| Daily Pivot Point R1 | 76.70 |
| Daily Pivot Point R2 | 77.68 |
| Daily Pivot Point R3 | 78.51 |
[/s2If]
Join Our Telegram Group
")


