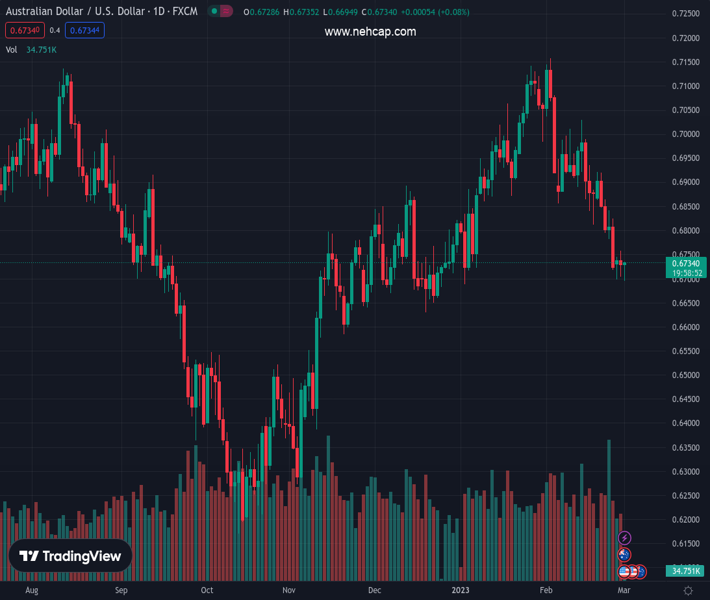
#AUDUSD @ 0.67325 rebounds from multi-day low on upbeat data from key customer. (Pivot Orderbook analysis)
…
This is a premium post.
[s2If !current_user_can(access_s2member_level4)]Please register for PREMIUM VERSION HERE to read full post below containing analysis. In case of any error or you think you are not able to read the full post below, please email us at support#nehcap.com [lwa][/s2If] [s2If current_user_can(access_s2member_level4)]
- AUD/USD rebounds from multi-day low on upbeat data from key customer.
- China’s official and Caxin PMIs flash upbeat figures for February.
- Downbeat Aussie GDP, inflation data joined risk-off mood to print recent trough.
The pair currently trades last at 0.67325.
The previous day high was 0.6758 while the previous day low was 0.6704. The daily 38.2% Fib levels comes at 0.6724, expected to provide support. Similarly, the daily 61.8% fib level is at 0.6737, expected to provide resistance.
AUD/USD picks up bids to reverse early losses to around 0.6730 after China data pleased Aussie bulls, after an initial disappointment from the statistics at home, during early Wednesday.
China’s Caixin Manufacturing PMI rose to 51.6 versus 50.2 expected and 49.2 for February. In doing so, the private manufacturing activity gauge traced the official numbers. Earlier in the day, China NBS Manufacturing PMI jumped to 52.6 compared to 50.5 market forecasts and 50.1 prior. More importantly, Non-Manufacturing PMI rallied to 56.3 versus analysts’ expectations of 49.7 and 54.4 previous readings.
Also read: China’s Caixin Manufacturing PMI expands to 51.6 in February vs. 50.2 expected
It’s worth noting that the downbeat prints of Australia’s fourth-quarter (Q4) Gross Domestic Product (GDP) and Monthly Consumer Price Index (CPI) data for January earlier drowned the AUD/USD pair towards refreshing the two-month low. Talking about that, Aussie Q4 GDP came in lower than expected 0.8% and 0.6% prior readings while flashing 0.5% quarterly growth. The yearly GDP growth, however, matches 2.7% market consensus, down from 5.9% prior. On the same line was the monthly CPI data for January as it dropped to 7.4% versus 8.0% expected and 8.4% prior.
Elsewhere, fears of more inflation and higher rates seem to have weighed on the market sentiment and propelled the US Treasury bond yields, while also exerting downside pressure on the stock futures. The same joins chatters that China President Xi Jinping is up for a big overhaul of Chinese government agencies and a likely increase in the US-China tension, signaled by Bloomberg.
To sum up, AUD/USD cheers upbeat data from the key customer to lure buyers but the upside bias remains absent amid the hawkish Fed concerns and inflation fears. That said, the US ISM Manufacturing PMI for February will be important for intraday directions.
AUD/USD bulls need validation from the 200-DMA hurdle surrounding 0.6800 to retake control.
Technical Levels: Supports and Resistances
AUDUSD currently trading at 0.6723 at the time of writing. Pair opened at 0.6726 and is trading with a change of -0.04% % .
| Overview | Overview.1 | |
|---|---|---|
| 0 | Today last price | 0.6723 |
| 1 | Today Daily Change | -0.0003 |
| 2 | Today Daily Change % | -0.04% |
| 3 | Today daily open | 0.6726 |
The pair remains strongly bearish on the daily time frame. It trades below the 20 SMA @ 0.6898, 50 SMA 0.6895, 100 SMA @ 0.6735 and 200 SMA @ 0.6797.
| Trends | Trends.1 | |
|---|---|---|
| 0 | Daily SMA20 | 0.6898 |
| 1 | Daily SMA50 | 0.6895 |
| 2 | Daily SMA100 | 0.6735 |
| 3 | Daily SMA200 | 0.6797 |
The previous day high was 0.6758 while the previous day low was 0.6704. The daily 38.2% Fib levels comes at 0.6724, expected to provide support. Similarly, the daily 61.8% fib level is at 0.6737, expected to provide resistance.
Note the levels of interest below:
- Pivot support is noted at 0.6701, 0.6676, 0.6647
- Pivot resistance is noted at 0.6754, 0.6783, 0.6808
| Levels | Levels.1 |
|---|---|
| Previous Daily High | 0.6758 |
| Previous Daily Low | 0.6704 |
| Previous Weekly High | 0.6921 |
| Previous Weekly Low | 0.6719 |
| Previous Monthly High | 0.7158 |
| Previous Monthly Low | 0.6698 |
| Daily Fibonacci 38.2% | 0.6724 |
| Daily Fibonacci 61.8% | 0.6737 |
| Daily Pivot Point S1 | 0.6701 |
| Daily Pivot Point S2 | 0.6676 |
| Daily Pivot Point S3 | 0.6647 |
| Daily Pivot Point R1 | 0.6754 |
| Daily Pivot Point R2 | 0.6783 |
| Daily Pivot Point R3 | 0.6808 |
[/s2If]
Join Our Telegram Group
")


