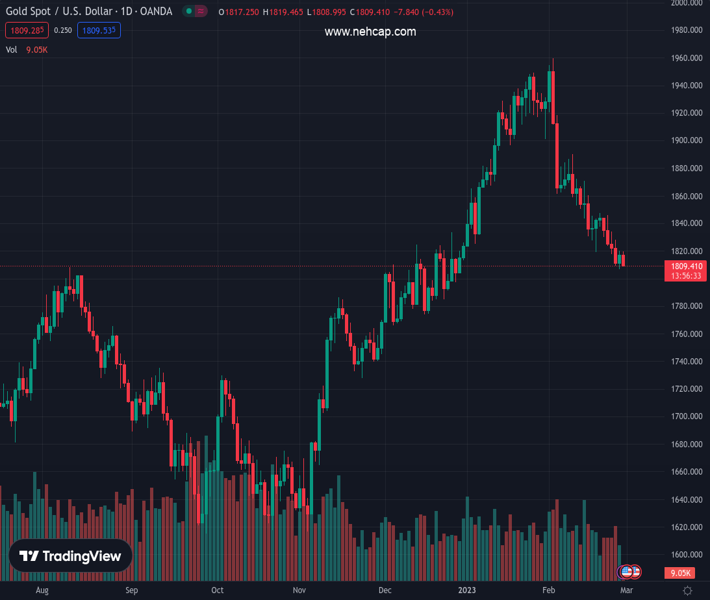
#XAUUSD @ 1,809.34 Gold price comes under renewed selling pressure amid reviving USD demand. (Pivot Orderbook analysis)
…
This is a premium post.
[s2If !current_user_can(access_s2member_level4)]Please register for PREMIUM VERSION HERE to read full post below containing analysis. In case of any error or you think you are not able to read the full post below, please email us at support#nehcap.com [lwa][/s2If] [s2If current_user_can(access_s2member_level4)]
- Gold price comes under renewed selling pressure amid reviving USD demand.
- Hawkish Fed expectations, elevated US bond yields underpin the Greenback.
- Recession fears lend support to the safe-haven XAU/USD and help limit losses.
The pair currently trades last at 1809.34.
The previous day high was 1820.21 while the previous day low was 1806.66. The daily 38.2% Fib levels comes at 1815.03, expected to provide resistance. Similarly, the daily 61.8% fib level is at 1811.84, expected to provide resistance.
Gold price struggles to capitalize on the previous day’s modest rebound from the $1,807-$1,806 area, or the YTD low and meets with a fresh supply on Tuesday. The XAU/USD remains depressed through the early European session and is currently placed just above the $1,810 level, down nearly 0.30% for the day.
Following a modest pullback from a seven-week high on Monday, the US Dollar (USD) is back in demand amid expectations for further policy tightening by the Federal Reserve (Fed). This, in turn, is seen as a key factor exerting some downward pressure on the US Dollar-denominated Gold price. The markets now seem convinced that the Fed will stick to its hawkish stance in the wake of stubbornly high inflation.
The bets were lifted by the Personal Consumption Expenditure (PCE) Price Index from the United States (US), which indicated that inflation isn’t coming down quite as fast as hoped. Moreover, several Fed officials stressed the need to raise interest rates to bring inflation down. This remains supportive of elevated US Treasury bond yields and further drives flow away from the non-yielding Gold price.
Investors, meanwhile, remain worried about economic headwinds stemming from rapidly rising borrowing costs. This, along with geopolitical tensions, keeps a lid on the overnight optimistic move in the equity markets and lends some support to the safe-haven Gold price. This, in turn, warrants caution before placing fresh bearish bets around the XAU/USD and positioning for a further depreciating move.
Nevertheless, the prospects for further policy tightening by the Fed should continue to boost the Greenback and favours the XAU/USD bears. Gold price seems poised to weaken further below the $1,800 mark and test the 100-day Simple Moving Average (SMA) support, currently around the $1,792 area. This should act as a pivotal point, which if broken decisively will set the stage for deeper losses.
Technical Levels: Supports and Resistances
XAUUSD currently trading at 1812.22 at the time of writing. Pair opened at 1817.32 and is trading with a change of -0.28 % .
| Overview | Overview.1 | |
|---|---|---|
| 0 | Today last price | 1812.22 |
| 1 | Today Daily Change | -5.10 |
| 2 | Today Daily Change % | -0.28 |
| 3 | Today daily open | 1817.32 |
The pair is trading below its 20 Daily moving average @ 1858.92, below its 50 Daily moving average @ 1865.96 , above its 100 Daily moving average @ 1793.84 and above its 200 Daily moving average @ 1775.83
| Trends | Trends.1 | |
|---|---|---|
| 0 | Daily SMA20 | 1858.92 |
| 1 | Daily SMA50 | 1865.96 |
| 2 | Daily SMA100 | 1793.84 |
| 3 | Daily SMA200 | 1775.83 |
The previous day high was 1820.21 while the previous day low was 1806.66. The daily 38.2% Fib levels comes at 1815.03, expected to provide resistance. Similarly, the daily 61.8% fib level is at 1811.84, expected to provide resistance.
Note the levels of interest below:
- Pivot support is noted at 1809.25, 1801.18, 1795.7
- Pivot resistance is noted at 1822.8, 1828.28, 1836.35
| Levels | Levels.1 |
|---|---|
| Previous Daily High | 1820.21 |
| Previous Daily Low | 1806.66 |
| Previous Weekly High | 1847.59 |
| Previous Weekly Low | 1808.99 |
| Previous Monthly High | 1949.27 |
| Previous Monthly Low | 1823.76 |
| Daily Fibonacci 38.2% | 1815.03 |
| Daily Fibonacci 61.8% | 1811.84 |
| Daily Pivot Point S1 | 1809.25 |
| Daily Pivot Point S2 | 1801.18 |
| Daily Pivot Point S3 | 1795.70 |
| Daily Pivot Point R1 | 1822.80 |
| Daily Pivot Point R2 | 1828.28 |
| Daily Pivot Point R3 | 1836.35 |
[/s2If]
Join Our Telegram Group
")


