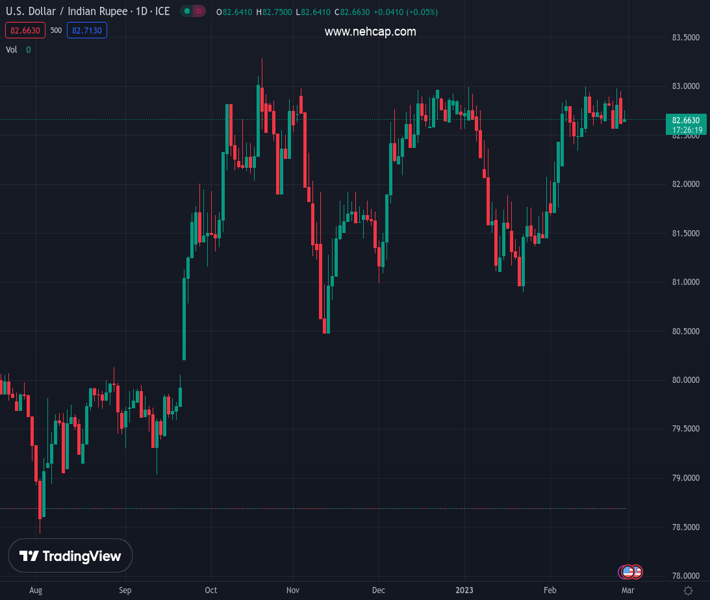
#USDINR @ 82.6830 has shifted its range below 82.70 amid an overnight correction in the USD Index. (Pivot Orderbook analysis)
…
This is a premium post.
[s2If !current_user_can(access_s2member_level4)]Please register for PREMIUM VERSION HERE to read full post below containing analysis. In case of any error or you think you are not able to read the full post below, please email us at support#nehcap.com [lwa][/s2If] [s2If current_user_can(access_s2member_level4)]
- USD/INR has shifted its range below 82.70 amid an overnight correction in the USD Index.
- The Indian Rupee will display a power-pack action after the release of the Q3 GDP data.
- S&P500 futures have further added gains after a modest positive Monday, portraying ease in the risk-off mood.
The pair currently trades last at 82.6830.
The previous day high was 83.082 while the previous day low was 82.6265. The daily 38.2% Fib levels comes at 82.8005, expected to provide resistance. Similarly, the daily 61.8% fib level is at 82.908, expected to provide resistance.
The USD/INR pair has shifted its business below 82.70 in the Asian session led by an overnight sell-off in the US Dollar Index (DXY). The asset has slipped as investors have ignored clouds of uncertainty associated with accelerating consumer spending in the United States amid an upbeat labor market.
US tight labor market has shifted the bargaining power in the favor of job seekers from the hiring agencies amid a shortage of labor. This has flushed significant liquidity in the palms of households for disposal, which is fueling retail demand efficiently. No doubt, the fears of more rates by the Federal Reserve (Fed) are skyrocketing. But for now, the risk-off profile has eased gradually.
S&P500 futures have further added gains after a modest positive Monday session, portraying an improvement in the risk appetite of the market participants. The alpha generated on 10-year US treasury bonds has turned lackluster around 3.92%.
Meanwhile, the Indian Rupee will display a power-pack action after the release of the Q3 Gross Domestic Product (GDP) data for FY2022-23. The Indian economy showed double-digit growth in Q1 as helicopter money released by the Indian administration and expansionary monetary policy by the Reserve Bank of India (RBI) was spurting overall growth. In the second quarter, GDP started moderating and trimmed to 6.3% as the administration started contracting liquidity to bring down galloping inflation.
The RBI projected the real GDP growth for 2022-23 at 6.8% and for the third quarter at 4.4%.
On the oil front, the oil price has recovered to near $75.80 as the economy is betting on China’s reopening after a prolonged lockdown to contain the pandemic. It is worth noting that India is one of the leading importers of oil in the world and higher oil prices can impact the Indian rupee.
Technical Levels: Supports and Resistances
USDINR currently trading at 82.7165 at the time of writing. Pair opened at 82.6541 and is trading with a change of 0.08 % .
| Overview | Overview.1 | |
|---|---|---|
| 0 | Today last price | 82.7165 |
| 1 | Today Daily Change | 0.0624 |
| 2 | Today Daily Change % | 0.0800 |
| 3 | Today daily open | 82.6541 |
The pair remains strongly bullish on the daily timeframe. It trades above its 20 SMA @ 82.5873, 50 SMA 82.2712, 100 SMA @ 82.154 and 200 SMA @ 80.7833.
| Trends | Trends.1 | |
|---|---|---|
| 0 | Daily SMA20 | 82.5873 |
| 1 | Daily SMA50 | 82.2712 |
| 2 | Daily SMA100 | 82.1540 |
| 3 | Daily SMA200 | 80.7833 |
The previous day high was 83.082 while the previous day low was 82.6265. The daily 38.2% Fib levels comes at 82.8005, expected to provide resistance. Similarly, the daily 61.8% fib level is at 82.908, expected to provide resistance.
Note the levels of interest below:
- Pivot support is noted at 82.4931, 82.332, 82.0376
- Pivot resistance is noted at 82.9486, 83.243, 83.4041
| Levels | Levels.1 |
|---|---|
| Previous Daily High | 83.0820 |
| Previous Daily Low | 82.6265 |
| Previous Weekly High | 83.0256 |
| Previous Weekly Low | 82.5615 |
| Previous Monthly High | 83.0720 |
| Previous Monthly Low | 80.8822 |
| Daily Fibonacci 38.2% | 82.8005 |
| Daily Fibonacci 61.8% | 82.9080 |
| Daily Pivot Point S1 | 82.4931 |
| Daily Pivot Point S2 | 82.3320 |
| Daily Pivot Point S3 | 82.0376 |
| Daily Pivot Point R1 | 82.9486 |
| Daily Pivot Point R2 | 83.2430 |
| Daily Pivot Point R3 | 83.4041 |
[/s2If]
Join Our Telegram Group
")


