#GBPUSD @ 1.20542 remains sidelined after rising the most in seven weeks., @nehcap view: Further upside expected (Pivot Orderbook analysis)
…
This is a premium post.
[s2If !current_user_can(access_s2member_level4)]Please register for PREMIUM VERSION HERE to read full post below containing analysis. In case of any error or you think you are not able to read the full post below, please email us at support#nehcap.com [lwa][/s2If] [s2If current_user_can(access_s2member_level4)]
- GBP/USD remains sidelined after rising the most in seven weeks.
- UK PM Sunak manages to strike all-around acceptability with latest Brexit deal.
- Sluggish oscillators probe traders around previous resistance line.
- Key DMAs, support line challenge Cable bears despite snapping four-month uptrend in February.
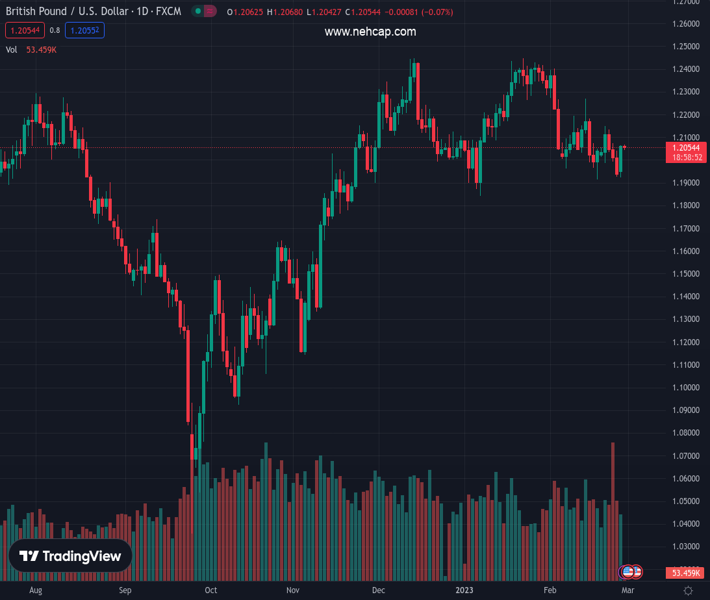
The pair currently trades last at 1.20542.
The previous day high was 1.2066 while the previous day low was 1.1922. The daily 38.2% Fib levels comes at 1.2011, expected to provide support. Similarly, the daily 61.8% fib level is at 1.1977, expected to provide support.
GBP/USD struggles to extend the Brexit deal-induced gains around 1.2050-60 during early Tuesday. Even so, the Cable pair defends the previous day’s rebound from the key technical levels while also keeping the upside break of a short-term key resistance line, now support.
It’s worth noting that the sluggish MACD and RSI conditions challenge the Cable pair buyers after the quote rose the most on a daily since early January. That said, the GBP/USD remains on the way to posting the first monthly loss in five.
On a different page, optimism surrounding UK Prime Minister Rishi Sunak’s Brexit deal keeps the GBP/USD buyers hopeful as most of the hard Brexiteers have so far praised the initial deal for the Northern Ireland Protocol (NIP) that needs UK Parliamentary approval.
Also read: UK PM Sunak: Found a way to end the uncertainty for Northern Ireland
Hence, recent inaction in the market pushes back the bearish bias surrounding the GBP/USD as it defends the previous day’s fundamental, as well as technical, catalysts that recalled the bulls on Monday.
As a result, the Cable pair is on the way to poking a downward-sloping resistance line from February 02, close to 1.2110 by the press time, unless it drops below the resistance-turned-support line near 1.2040.
Even if the quote drops below 1.2040, the 100-DMA and 200-DMA, respectively near 1.1960 and 1.1920, could challenge the GBP/USD bears. Also acting as a downside filter is an upward-sloping support line from early January, close to 1.1930 by the press time.
On the flip side, a successful break of the 1.2110 resistance line could propel the GBP/USD price toward the mid-February high surrounding 1.2270. However, the double tops marked near 1.2445-50 appear a tough nut to crack for the bulls afterward.
Trend: Further upside expected
Technical Levels: Supports and Resistances
GBPUSD currently trading at 1.2058 at the time of writing. Pair opened at 1.2058 and is trading with a change of 0.00% % .
| Overview | Overview.1 | |
|---|---|---|
| 0 | Today last price | 1.2058 |
| 1 | Today Daily Change | 0.0000 |
| 2 | Today Daily Change % | 0.00% |
| 3 | Today daily open | 1.2058 |
The pair is trading below its 20 Daily moving average @ 1.2094, below its 50 Daily moving average @ 1.2147 , above its 100 Daily moving average @ 1.1951 and above its 200 Daily moving average @ 1.1928
| Trends | Trends.1 | |
|---|---|---|
| 0 | Daily SMA20 | 1.2094 |
| 1 | Daily SMA50 | 1.2147 |
| 2 | Daily SMA100 | 1.1951 |
| 3 | Daily SMA200 | 1.1928 |
The previous day high was 1.2066 while the previous day low was 1.1922. The daily 38.2% Fib levels comes at 1.2011, expected to provide support. Similarly, the daily 61.8% fib level is at 1.1977, expected to provide support.
Note the levels of interest below:
- Pivot support is noted at 1.1965, 1.1872, 1.1821
- Pivot resistance is noted at 1.2109, 1.2159, 1.2252
| Levels | Levels.1 |
|---|---|
| Previous Daily High | 1.2066 |
| Previous Daily Low | 1.1922 |
| Previous Weekly High | 1.2148 |
| Previous Weekly Low | 1.1928 |
| Previous Monthly High | 1.2448 |
| Previous Monthly Low | 1.1841 |
| Daily Fibonacci 38.2% | 1.2011 |
| Daily Fibonacci 61.8% | 1.1977 |
| Daily Pivot Point S1 | 1.1965 |
| Daily Pivot Point S2 | 1.1872 |
| Daily Pivot Point S3 | 1.1821 |
| Daily Pivot Point R1 | 1.2109 |
| Daily Pivot Point R2 | 1.2159 |
| Daily Pivot Point R3 | 1.2252 |
[/s2If]
Join Our Telegram Group
")


