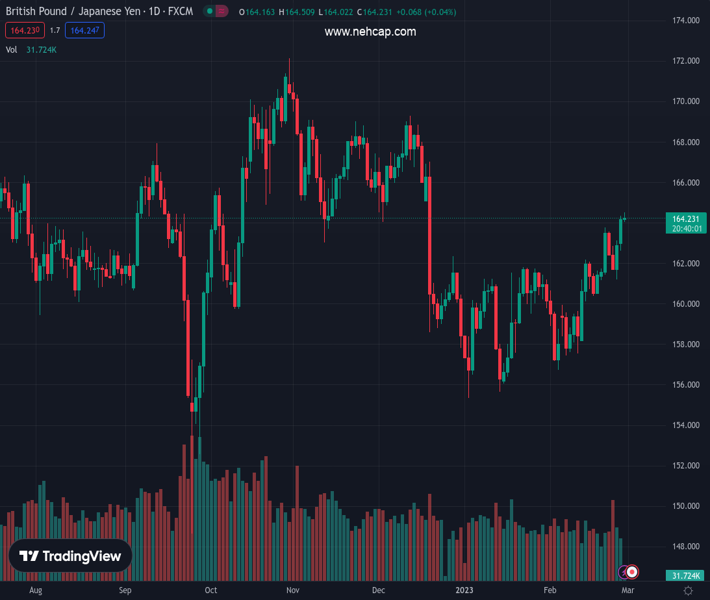
#GBPJPY @ 164.240 The cross is picking strength amid weakness in the Japanese Yen led by BoJ Ueda’s dovish stance. (Pivot Orderbook analysis)
…
This is a premium post.
[s2If !current_user_can(access_s2member_level4)]Please register for PREMIUM VERSION HERE to read full post below containing analysis. In case of any error or you think you are not able to read the full post below, please email us at support#nehcap.com [lwa][/s2If] [s2If current_user_can(access_s2member_level4)]
- The cross is picking strength amid weakness in the Japanese Yen led by BoJ Ueda’s dovish stance.
- GBP/JPY is in a markup phase after delivering a breakout of Wyckoff’s Accumulation.
- The RSI (14) is aiming to shift to the bullish range of 60.00-80.00, which will result in a bullish momentum ahead.
The pair currently trades last at 164.240.
The previous day high was 164.31 while the previous day low was 162.61. The daily 38.2% Fib levels comes at 163.66, expected to provide support. Similarly, the daily 61.8% fib level is at 163.26, expected to provide support.
The GBP/JPY pair has refreshed its two-month high at around 164.46 in the Asian session after continuing its two-day winning streak. The cross is picking strength amid weakness in the Japanese Yen led by the dovish stance adopted by Bank of Japan (BoJ) Governor Nominee Kazuo Ueda over monetary policy guidance.
BoJ Ueda considers the current monetary policy as appropriate for spurting the wages and growth rate as a recent jump in Japan’s inflationary pressures is backed by rising import prices. Therefore, a sustained 2% inflation target can be achieved by keeping the expansionary monetary policy intact.
Meanwhile, the Pound Sterling is enjoying gains due to the smooth flow of the Northern Ireland deal with European Commission (EC) President Ursula von der Leyen. The Agreement assures smooth free-flowing trade from the European Union with the United Kingdom citing the UK and EU are allies, friends, and trading partners.
On a daily scale, GBP/JPY is in a markup phase after delivering a breakout of Wyckoff’s Accumulation pattern. Wyckoff’s accumulation indicates a period of inventory shift from the retail participants to the institutional investors. The cross is marching towards the horizontal resistance plotted from November 17 high around 169.10.
The 10-period Exponential Moving Average (EMA) at 162.65 will continue to provide support to the Pound Sterling bulls.
Meanwhile, the Relative Strength Index (RSI) (14) is aiming to shift to the bullish range of 60.00-80.00, which will result in a bullish momentum ahead.
A decisive break above the immediate resistance of 164.50 will drive the cross toward December 20 high around 167.00 followed by the ultimate resistance plotted from November 17 high around 169.10.
Alternatively, a break below February 24 low at 161.22 will negate the bullish reversal and will drag the asset toward February 14 low at 160.11 and January 25 low at 159.50.
Technical Levels: Supports and Resistances
GBPJPY currently trading at 164.44 at the time of writing. Pair opened at 164.29 and is trading with a change of 0.09 % .
| Overview | Overview.1 | |
|---|---|---|
| 0 | Today last price | 164.44 |
| 1 | Today Daily Change | 0.15 |
| 2 | Today Daily Change % | 0.09 |
| 3 | Today daily open | 164.29 |
The pair remains strongly bullish on the daily timeframe. It trades above its 20 SMA @ 160.6, 50 SMA 160.05, 100 SMA @ 163.6 and 200 SMA @ 163.36.
| Trends | Trends.1 | |
|---|---|---|
| 0 | Daily SMA20 | 160.60 |
| 1 | Daily SMA50 | 160.05 |
| 2 | Daily SMA100 | 163.60 |
| 3 | Daily SMA200 | 163.36 |
The previous day high was 164.31 while the previous day low was 162.61. The daily 38.2% Fib levels comes at 163.66, expected to provide support. Similarly, the daily 61.8% fib level is at 163.26, expected to provide support.
Note the levels of interest below:
- Pivot support is noted at 163.16, 162.04, 161.46
- Pivot resistance is noted at 164.87, 165.44, 166.57
| Levels | Levels.1 |
|---|---|
| Previous Daily High | 164.31 |
| Previous Daily Low | 162.61 |
| Previous Weekly High | 163.76 |
| Previous Weekly Low | 161.17 |
| Previous Monthly High | 161.85 |
| Previous Monthly Low | 155.36 |
| Daily Fibonacci 38.2% | 163.66 |
| Daily Fibonacci 61.8% | 163.26 |
| Daily Pivot Point S1 | 163.16 |
| Daily Pivot Point S2 | 162.04 |
| Daily Pivot Point S3 | 161.46 |
| Daily Pivot Point R1 | 164.87 |
| Daily Pivot Point R2 | 165.44 |
| Daily Pivot Point R3 | 166.57 |
[/s2If]
Join Our Telegram Group
")


