Asian indices have rebounded comprehensively as investors shrug off Fed rate hike fears. (Pivot Orderbook analysis)
…
This is a premium post.
[s2If !current_user_can(access_s2member_level4)]Please register for PREMIUM VERSION HERE to read full post below containing analysis. In case of any error or you think you are not able to read the full post below, please email us at support#nehcap.com [lwa][/s2If] [s2If current_user_can(access_s2member_level4)]
- Asian indices have rebounded comprehensively as investors shrug off Fed rate hike fears.
- Chinese stocks will remain volatile ahead of the Caixin Manufacturing PMI data.
- BoJ Himino has also considered the easy monetary policy as appropriate till the central bank achieves 2% inflation confidently.
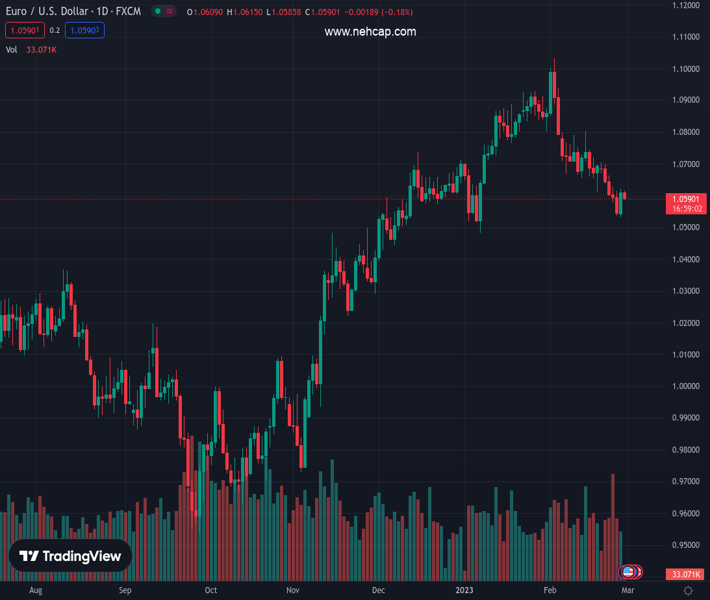
The pair currently trades last at 27564.25.
The previous day high was 27595.57 while the previous day low was 27341.7. The daily 38.2% Fib levels comes at 27498.59, expected to provide support. Similarly, the daily 61.8% fib level is at 27438.68, expected to provide support.
Markets in the Asian domain have shown an overall recovery as fears of more rates by the Federal Reserve (Fed) to achieve price stability amid rising consumer spending in the United States has faded. A rebound in the risk appetite theme has infused some strength into the risk-sensitive assets. The US Dollar Index (DXY) has rebounded after a perpendicular correction to near 104.20. The recovery move in the USD Index looks fragile as investors’ risk-taking ability is improving gradually.
At the press time, Japan’s Nikkei225 added 0.17%, ChinaA50 gained 0.11%, Hang Seng jumped 0.46%, and Nifty50 recovered 0.20%.
A sheer caution is expected for Chinese stocks as investors are awaiting the release of the Caixin Manufacturing PMI, which is scheduled for Wednesday. The street is anticipating a power-pack recovery in the Chinese economy after remaining locked for three years to contain the spread of Covid-19. Chinese administration is pumping stimulus to trigger economic recovery. Also, the People’s Bank of China (PBoC) has promised an expansionary monetary policy to revive growth.
Japanese equities seem directionless amid dovish stances from Bank of Japan (BoJ) policymakers. After dovish remarks from BoJ Governor Nominee Kazuo Ueda, BoJ Deputy Governor Ryozo Himino has also considered the easy monetary policy as appropriate for now. However, BoJ Himino has also cited an optimal time will come when the BoJ would exit easy policy, which will be good for both the public and banks.
The oil price is on the verge of reclaiming the 76.00 resistance as investors are worried that sheer supply cuts from Russia will trigger the demand-supply equilibrium. The black gold will remain in action as the US American Petroleum Institute (API) will release the oil inventories data for the week ending February 24.
Technical Levels: Supports and Resistances
EURUSD currently trading at 27564.25 at the time of writing. Pair opened at 27564.25 and is trading with a change of 0.0 % .
| Overview | Overview.1 | |
|---|---|---|
| 0 | Today last price | 27564.25 |
| 1 | Today Daily Change | 0.00 |
| 2 | Today Daily Change % | 0.00 |
| 3 | Today daily open | 27564.25 |
The pair remains strongly bullish on the daily timeframe. It trades above its 20 SMA @ 27535.82, 50 SMA 26881.02, 100 SMA @ 27256.29 and 200 SMA @ 27312.65.
| Trends | Trends.1 | |
|---|---|---|
| 0 | Daily SMA20 | 27535.82 |
| 1 | Daily SMA50 | 26881.02 |
| 2 | Daily SMA100 | 27256.29 |
| 3 | Daily SMA200 | 27312.65 |
The previous day high was 27595.57 while the previous day low was 27341.7. The daily 38.2% Fib levels comes at 27498.59, expected to provide support. Similarly, the daily 61.8% fib level is at 27438.68, expected to provide support.
Note the levels of interest below:
- Pivot support is noted at 27405.44, 27246.64, 27151.57
- Pivot resistance is noted at 27659.31, 27754.38, 27913.18
| Levels | Levels.1 |
|---|---|
| Previous Daily High | 27595.57 |
| Previous Daily Low | 27341.70 |
| Previous Weekly High | 27556.86 |
| Previous Weekly Low | 26985.47 |
| Previous Monthly High | 27619.58 |
| Previous Monthly Low | 25549.18 |
| Daily Fibonacci 38.2% | 27498.59 |
| Daily Fibonacci 61.8% | 27438.68 |
| Daily Pivot Point S1 | 27405.44 |
| Daily Pivot Point S2 | 27246.64 |
| Daily Pivot Point S3 | 27151.57 |
| Daily Pivot Point R1 | 27659.31 |
| Daily Pivot Point R2 | 27754.38 |
| Daily Pivot Point R3 | 27913.18 |
[/s2If]
Join Our Telegram Group
")


