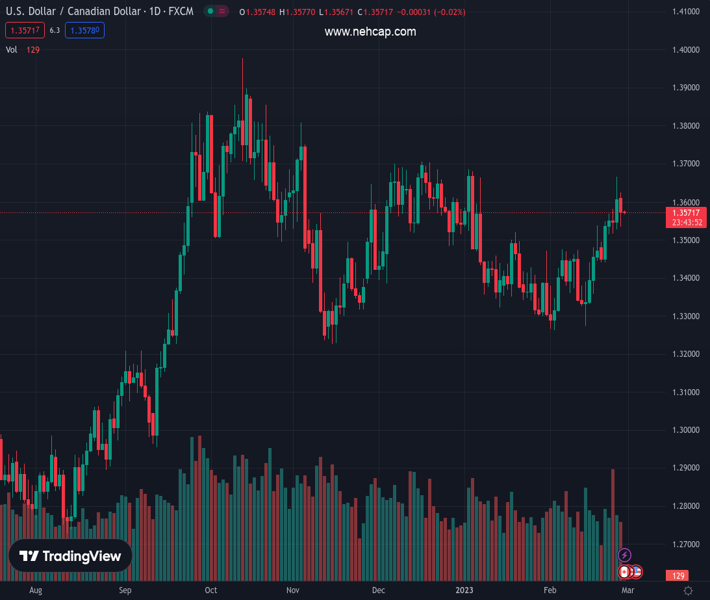
#USDCAD @ 1.35707 is advancing towards 1.3600 as USD Index has found an intermediate cushion around 104.20. (Pivot Orderbook analysis)
…
This is a premium post.
[s2If !current_user_can(access_s2member_level4)]Please register for PREMIUM VERSION HERE to read full post below containing analysis. In case of any error or you think you are not able to read the full post below, please email us at support#nehcap.com [lwa][/s2If] [s2If current_user_can(access_s2member_level4)]
- USD/CAD is advancing towards 1.3600 as USD Index has found an intermediate cushion around 104.20.
- Lower advance orders for the US durable goods indicate that core CPI could soften ahead.
- The oil price is expected to remain volatile ahead of the release of the oil inventories data by the US API.
The pair currently trades last at 1.35707.
The previous day high was 1.3666 while the previous day low was 1.3527. The daily 38.2% Fib levels comes at 1.3613, expected to provide resistance. Similarly, the daily 61.8% fib level is at 1.358, expected to provide resistance.
The USD/CAD pair is approaching the round-level resistance of 1.3600 in the early Asian session. The Loonie asset is in a sideways auction after a responsive buying move from 1.3540 as the US Dollar Index (DXY) finds an intermediate cushion around 104.20 after a sheer decline. The US Dollar witnessed an intense sell-off on Monday as investors ignored the fears of further rate hikes by the Federal Reserve (Fed) and shifted to the risk-perceived assets.
S&P500 settled Monday’s session with moderate gains as investors digested the fact that more rates by the Fed cannot be ruled out as the battle against stubborn inflation is getting more furious now. An improved risk appetite of the market participants barricaded the USD Index from hitting the 105.00 resistance and dragged it to near 104.20.
The demand for US government bonds increased a little, which resulted in a marginal drop in the yields offered by the 10-year US Treasury bonds to near 3.92%.
The catalyst that impacted the USD Index was the higher-than-anticipated contraction in the United States Durable Goods Orders data. The economic data was contracted by 4.5% while the street was expecting a contraction of 4.0%. Lower advance orders for durable goods indicate that the core Consumer Price Index (CPI) that excludes oil and food prices could soften ahead.
On Tuesday, the Canadian Dollar will dance to the tunes of Canada’s Gross Domestic Product (GDP) data. Analysts at Wells Fargo expect Canada’s GDP release to show that the economy remained resilient in the last quarter of 2022, with quarterly GDP (annualized) growth of 1.6% in Q4-2022. Heading into 2023, however, analysts expect that growth trends may begin to downshift. We forecast a mild recession in Canada in the first half of 2023.
Meanwhile, oil prices have shown a recovery move after finding support around $75.00. The oil price is aiming to extend its recovery above the immediate resistance of $75.80. The oil price is expected to remain volatile ahead of the release of the oil inventories data by the US American Petroleum Institute (API) for the week ending February 24.
Technical Levels: Supports and Resistances
USDCAD currently trading at 1.3575 at the time of writing. Pair opened at 1.3606 and is trading with a change of -0.23 % .
| Overview | Overview.1 | |
|---|---|---|
| 0 | Today last price | 1.3575 |
| 1 | Today Daily Change | -0.0031 |
| 2 | Today Daily Change % | -0.2300 |
| 3 | Today daily open | 1.3606 |
The pair remains strongly bullish on the daily timeframe. It trades above its 20 SMA @ 1.3424, 50 SMA 1.3462, 100 SMA @ 1.3512 and 200 SMA @ 1.3264.
| Trends | Trends.1 | |
|---|---|---|
| 0 | Daily SMA20 | 1.3424 |
| 1 | Daily SMA50 | 1.3462 |
| 2 | Daily SMA100 | 1.3512 |
| 3 | Daily SMA200 | 1.3264 |
The previous day high was 1.3666 while the previous day low was 1.3527. The daily 38.2% Fib levels comes at 1.3613, expected to provide resistance. Similarly, the daily 61.8% fib level is at 1.358, expected to provide resistance.
Note the levels of interest below:
- Pivot support is noted at 1.3534, 1.3462, 1.3396
- Pivot resistance is noted at 1.3672, 1.3738, 1.381
| Levels | Levels.1 |
|---|---|
| Previous Daily High | 1.3666 |
| Previous Daily Low | 1.3527 |
| Previous Weekly High | 1.3666 |
| Previous Weekly Low | 1.3441 |
| Previous Monthly High | 1.3685 |
| Previous Monthly Low | 1.3300 |
| Daily Fibonacci 38.2% | 1.3613 |
| Daily Fibonacci 61.8% | 1.3580 |
| Daily Pivot Point S1 | 1.3534 |
| Daily Pivot Point S2 | 1.3462 |
| Daily Pivot Point S3 | 1.3396 |
| Daily Pivot Point R1 | 1.3672 |
| Daily Pivot Point R2 | 1.3738 |
| Daily Pivot Point R3 | 1.3810 |
[/s2If]
Join Our Telegram Group
")


