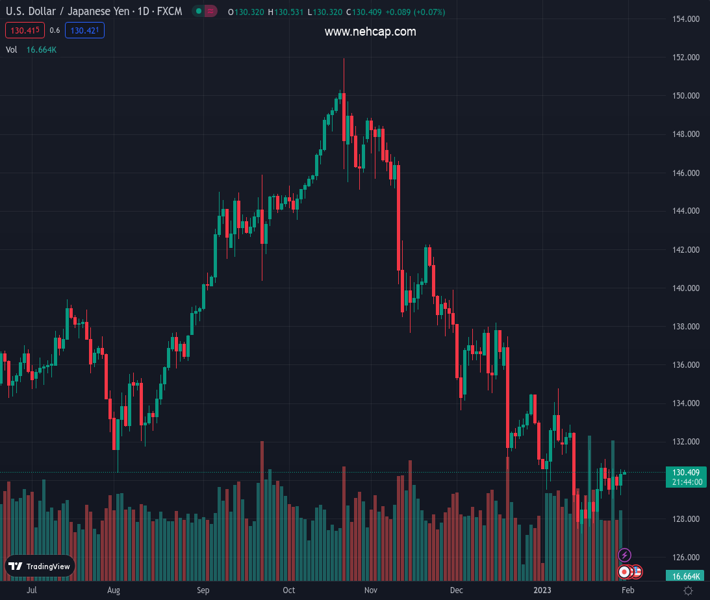
#USDJPY @ 130.396 struggles to extend week-start rebound amid strong statistics from Tokyo. (Pivot Orderbook analysis)
…
This is a premium post.
[s2If !current_user_can(access_s2member_level4)]Please register for PREMIUM VERSION HERE to read full post below containing analysis. In case of any error or you think you are not able to read the full post below, please email us at support#nehcap.com [lwa][/s2If] [s2If current_user_can(access_s2member_level4)]
- USD/JPY struggles to extend week-start rebound amid strong statistics from Tokyo.
- Japan’s Unemployment Rate remains unchanged but Industrial Production, Retail Trade cross market forecasts in December.
- Mixed sentiment, hawkish concerns surrounding BoJ keeps Yen pair sellers hopeful.
- US CB Consumer Confidence, risk catalysts will be crucial ahead of the FOMC.
The pair currently trades last at 130.396.
The previous day high was 130.57 while the previous day low was 129.21. The daily 38.2% Fib levels comes at 130.05, expected to provide support. Similarly, the daily 61.8% fib level is at 129.73, expected to provide support.
USD/JPY grinds higher around 130.50 as strong Japanese statistics renew the market’s concerns surrounding the Bank of Japan’s (BoJ) hawkish move during early Tuesday. In doing so, the Yen pair also probes the week-start run-up amid the sour sentiment ahead of the top-tier data/events.
Japan’s Unemployment Rate remains unchanged near 2.5% in December but the Retail Trade rose past 0.5% in market forecasts to 1.1% during the stated month. On the same line, the Industrial Production also crossed -1.2% consensus with -0.1% figure for December.
It should be noted that the market’s cautious mood ahead of this week’s Federal Open Market Committee (FOMC) and the US monthly jobs report triggered the rush toward the US Dollar the previous day, especially amid the firmer US Treasury bond yields. In doing so, the Yen pair ignored chatters surrounding the BoJ’s likely pushback to the 2.0% inflation commitment.
That said, the US 10-year Treasury bond yields rose 2.4 basis points (bps) to 3.542% while rising for the third consecutive day, mostly unchanged by the press time. As dovish bets on the Federal Reserve (Fed) take a halt even if the hawks are far from the entry.
Behind the moves could be the stronger prints of the US Dallas Fed manufacturing index for January which jumped to -8.4 while adding 11.6 points and marking the highest reading since May 2022.
Additionally, China’s inability to spread optimism after returning from the one-week-old Lunar New Year holiday, even with hopes of witnessing an end to the Covid wave, also favored the USD/JPY buyers.
It should be noted that the cautious risk profile before the equity heavyweights like Amazon, Alphabet, Apple and Metal release their quarterly earnings, also underpinned the USD/JPY run-up the previous day.
Alternatively, a government panel suggested the push to the 2.0% inflation target to a broader timeframe and triggered hopes of the BoJ’s hawkish move. On the same line could be the comments from BoJ Governor Haruhiko Kuroda who signaled that the inflation target is achievable.
Looking forward, USD/JPY may remain sidelined amid the dicey markets. However, the fourth quarter (Q4) US Employment Cost Index (ECI) and the Conference Board’s Consumer Confidence gauge for January will be crucial for the pair traders to watch for fresh impulses.
A daily closing beyond the 21-DMA level surrounding 130.35, the first early November 2021, keeps USD/JPY buyers hopeful.
Technical Levels: Supports and Resistances
USDJPY currently trading at 130.49 at the time of writing. Pair opened at 130.46 and is trading with a change of 0.02 % .
| Overview | Overview.1 | |
|---|---|---|
| 0 | Today last price | 130.49 |
| 1 | Today Daily Change | 0.03 |
| 2 | Today Daily Change % | 0.02 |
| 3 | Today daily open | 130.46 |
The pair is trading above its 20 Daily moving average @ 130.37, below its 50 Daily moving average @ 133.6 , below its 100 Daily moving average @ 139.34 and below its 200 Daily moving average @ 136.77
| Trends | Trends.1 | |
|---|---|---|
| 0 | Daily SMA20 | 130.37 |
| 1 | Daily SMA50 | 133.60 |
| 2 | Daily SMA100 | 139.34 |
| 3 | Daily SMA200 | 136.77 |
The previous day high was 130.57 while the previous day low was 129.21. The daily 38.2% Fib levels comes at 130.05, expected to provide support. Similarly, the daily 61.8% fib level is at 129.73, expected to provide support.
Note the levels of interest below:
- Pivot support is noted at 129.59, 128.72, 128.23
- Pivot resistance is noted at 130.95, 131.44, 132.32
| Levels | Levels.1 |
|---|---|
| Previous Daily High | 130.57 |
| Previous Daily Low | 129.21 |
| Previous Weekly High | 131.12 |
| Previous Weekly Low | 129.02 |
| Previous Monthly High | 138.18 |
| Previous Monthly Low | 130.57 |
| Daily Fibonacci 38.2% | 130.05 |
| Daily Fibonacci 61.8% | 129.73 |
| Daily Pivot Point S1 | 129.59 |
| Daily Pivot Point S2 | 128.72 |
| Daily Pivot Point S3 | 128.23 |
| Daily Pivot Point R1 | 130.95 |
| Daily Pivot Point R2 | 131.44 |
| Daily Pivot Point R3 | 132.32 |
[/s2If]
Join Our Telegram Group
")


