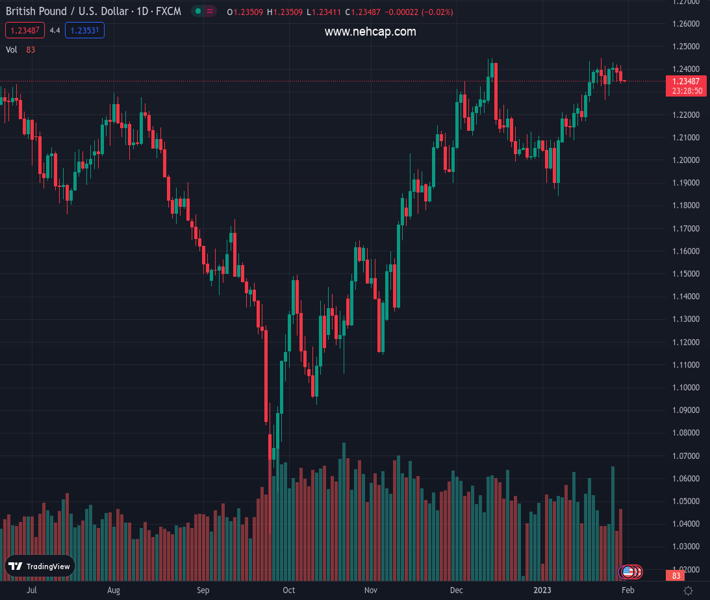
#GBPUSD @ 1.23472 began the key week on a back foot, stays pressured of late. (Pivot Orderbook analysis)
…
This is a premium post.
[s2If !current_user_can(access_s2member_level4)]Please register for PREMIUM VERSION HERE to read full post below containing analysis. In case of any error or you think you are not able to read the full post below, please email us at support#nehcap.com [lwa][/s2If] [s2If current_user_can(access_s2member_level4)]
- GBP/USD began the key week on a back foot, stays pressured of late.
- Market sentiment dwindles amid trader’s anxiety ahead of top-tier data/events.
- Mixed concerns surrounding UK’s tax cuts, workers’ strikes keep bears hopeful even as BoE hawks flex muscles.
- No major from Britain but US CB Consumer Confidence, Employment Cost Index may gain attention.
The pair currently trades last at 1.23472.
The previous day high was 1.2419 while the previous day low was 1.2346. The daily 38.2% Fib levels comes at 1.2374, expected to provide resistance. Similarly, the daily 61.8% fib level is at 1.2391, expected to provide resistance.
GBP/USD holds lower grounds after a two-day downtrend, making rounds to 1.2350 during early Tuesday morning in Asia. In doing so, the Cable pair takes clues from the broad US Dollar rebound as the market mood sours ahead of the key data/events. Adding strength to the quote’s from the key 1.2450 hurdle could be the economic problems and challenges for the UK policymakers.
At home, UK Treasury Secretary Jeremy Hunt’s indecision over the tax cuts and the economic complications due to the workers’ strikes weigh on the GBP/USD prices. Even so, the policymakers propose the fight to tame inflation as a cure to overcome the workers’ halting of workers and generate problems surrounding the same, including higher inflation and low productivity.
On the other hand, the US Dallas Fed manufacturing index for January jumped to -8.4 while adding 11.6 points and marking the highest reading since May 2022.
Not only the downbeat US data but firmer US Treasury bond yields and softer equities also weighed on the GBP/USD prices. That said, the US 10-year Treasury bond yields rose 2.4 basis points (bps) to 3.542% while Wall Street benchmarks closed in the red.
It’s worth noting that China’s return from a week-long Lunar New Year (LNY) holiday also couldn’t impress markets as traders received mixed signals surrounding the dragon nation’s economic transition during the holiday period, which in turn weighed on the risk appetite and the GBP/USD prices.
Having witnessed a sluggish start to the key week, mostly favoring the GBP/USD bears, the pair traders will pay attention to today’s US Conference Board Consumer Confidence gauge for January. Also important will be the fourth quarter (Q4) Employment Cost Index (ECI). That said, the Cable pair may witness a comparatively more active day than the previous one but a cautious mood can keep challenging the traders ahead of the monetary policy meeting of the US Federal Reserve (Fed) and the Bank of England.
The GBP/USD pair’s failure to cross the 1.2450 hurdle joins the clear downside break of the three-week-old ascending trend line, around 1.2370 by the press time, to direct the Cable bears towards the 21-DMA support near 1.2250.
Technical Levels: Supports and Resistances
GBPUSD currently trading at 1.2354 at the time of writing. Pair opened at 1.2391 and is trading with a change of -0.30% % .
| Overview | Overview.1 | |
|---|---|---|
| 0 | Today last price | 1.2354 |
| 1 | Today Daily Change | -0.0037 |
| 2 | Today Daily Change % | -0.30% |
| 3 | Today daily open | 1.2391 |
The pair remains strongly bullish on the daily timeframe. It trades above its 20 SMA @ 1.2226, 50 SMA 1.2163, 100 SMA @ 1.1766 and 200 SMA @ 1.1963.
| Trends | Trends.1 | |
|---|---|---|
| 0 | Daily SMA20 | 1.2226 |
| 1 | Daily SMA50 | 1.2163 |
| 2 | Daily SMA100 | 1.1766 |
| 3 | Daily SMA200 | 1.1963 |
The previous day high was 1.2419 while the previous day low was 1.2346. The daily 38.2% Fib levels comes at 1.2374, expected to provide resistance. Similarly, the daily 61.8% fib level is at 1.2391, expected to provide resistance.
Note the levels of interest below:
- Pivot support is noted at 1.2351, 1.2312, 1.2278
- Pivot resistance is noted at 1.2425, 1.2459, 1.2498
| Levels | Levels.1 |
|---|---|
| Previous Daily High | 1.2419 |
| Previous Daily Low | 1.2346 |
| Previous Weekly High | 1.2448 |
| Previous Weekly Low | 1.2263 |
| Previous Monthly High | 1.2447 |
| Previous Monthly Low | 1.1992 |
| Daily Fibonacci 38.2% | 1.2374 |
| Daily Fibonacci 61.8% | 1.2391 |
| Daily Pivot Point S1 | 1.2351 |
| Daily Pivot Point S2 | 1.2312 |
| Daily Pivot Point S3 | 1.2278 |
| Daily Pivot Point R1 | 1.2425 |
| Daily Pivot Point R2 | 1.2459 |
| Daily Pivot Point R3 | 1.2498 |
[/s2If]
Join Our Telegram Group
")


