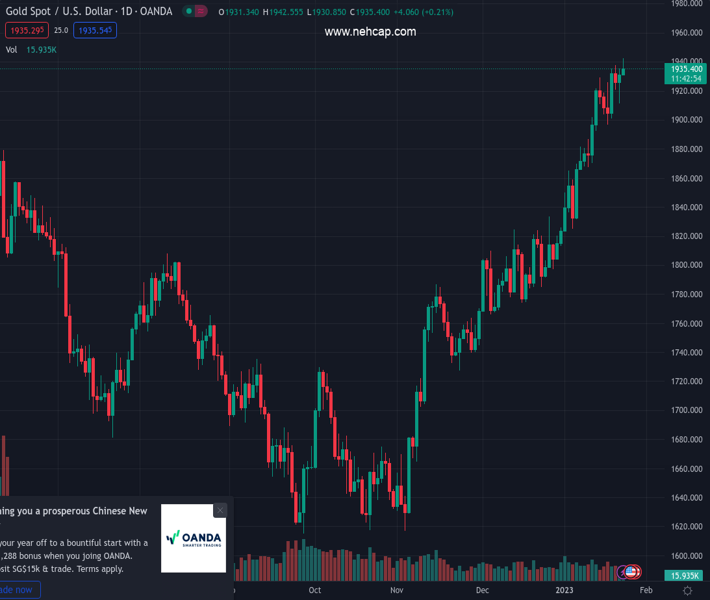
#XAUUSD @ 1,935.37 Gold price touches a nine-month top on Tuesday amid renewed US Dollar selling. (Pivot Orderbook analysis)
…
This is a premium post.
[s2If !current_user_can(access_s2member_level4)]Please register for PREMIUM VERSION HERE to read full post below containing analysis. In case of any error or you think you are not able to read the full post below, please email us at support#nehcap.com [lwa][/s2If] [s2If current_user_can(access_s2member_level4)]
- Gold price touches a nine-month top on Tuesday amid renewed US Dollar selling.
- Bets for smaller rate hikes by Federal Reserve continue to weigh on the greenback.
- Recession fears further benefit the safe-haven XAU/USD and favour bullish traders.
The pair currently trades last at 1935.37.
The previous day high was 1935.62 while the previous day low was 1911.45. The daily 38.2% Fib levels comes at 1926.39, expected to provide support. Similarly, the daily 61.8% fib level is at 1920.68, expected to provide support.
Gold price builds on the previous day’s modest uptick and gains some follow-through traction for the second successive day on Tuesday. The momentum pushes the XAU/USD to its highest level since April 22, around the $1,942-$1,943 region during the early European session, though lacks follow-through.
The US Dollar (USD) meets with a fresh supply and hits a new nine-month low amid firming expectations for a less aggressive policy tightening by the Federal Reserve (Fed). Investors now seem convinced that the Fed will soften its hawkish stance amid signs of easing inflationary pressures in the United States (US). In fact, the markets have been pricing in a smaller 25 bps rate hike at the upcoming Federal Open Market Committee (FOMC) policy meeting next week. This leads to a modest downtick in the US Treasury bond yields and continues to weigh on the greenback, which, in turn, is seen benefitting the US Dollar-denominated Gold price.
Apart from this, the cautious mood is seen as another factor acting as a tailwind for the safe-haven XAU/USD. The market sentiment remains fragile amid growing worries about headwinds stemming from the worst yet COVID-19 outbreak in China. Furthermore, the protracted Russia-Ukraine war has been fueling worries about a deeper global economic downturn. This, in turn, tempers investors’ appetite for riskier assets and drives some haven flows towards traditional safe-haven assets, including Gold price. The upside, however, remains limited as traders seem reluctant ahead of the key event/central bank event risks from the United States.
Investors prefer to move to the sidelines and look to the first estimate of the fourth-quarter US GDP growth, due on Thursday. Any signs of a weaker US economy will be taken as a reason for the Fed to slow the pace of its rate-hiking cycle, which should benefit the non-yielding Gold price. Apart from this, this week’s release of the US Personal Consumption Expenditures (PCE) Price Index on Friday will influence the Fed’s interest rate strategy and provide some meaningful impetus to the XAU/USD. The focus, however, will remain glued to the highly-anticipated FOMC monetary policy decision, scheduled to be announced next Wednesday.
In the meantime, the US macro data – the flash PMI prints and the Richmond Manufacturing Index – could produce short-term opportunities later during the early North American session this Tuesday. Apart from this, traders will take cues from the US bond yields, which, along with the USD price dynamics and the broader market risk sentiment, could drive Gold price. Nevertheless, the fundamental backdrop seems tilted in favour of bullish traders and supports prospects for an extension of a nearly three-month-old bullish trajectory.
From a technical perspective, the emergence of some dip-buying on Monday and a sustained strength above the $1,920 level add credence to the positive outlook for Gold price. That said, Relative Strength Index (RSI 14) on the daily chart is flashing overbought conditions and makes it prudent to wait for some near-term consolidation before positioning for further gains. That said, some follow-through buying beyond the daily peak, around the $1,942-$1,943 area, might still lift the XAU/USD to the next relevant hurdle near the $1,969-$1,970 region. This is followed by the $1,980 barrier, above which bulls could aim to reclaim the $2,000 psychological mark for the first time since March 2022.
On the flip side, the $1,920 horizontal resistance breakpoint might now protect the immediate downside for Gold price. Any subsequent decline might continue to attract some buyers near the $1,911-$1,910 area and remain limited near the $1,900 round figure. The latter should act as a pivotal point, which if broken decisively might shift the near-term bias in favour of bearish traders and pave the way for a deeper corrective pullback.
Technical Levels: Supports and Resistances
XAUUSD currently trading at 1936.15 at the time of writing. Pair opened at 1931.26 and is trading with a change of 0.25 % .
| Overview | Overview.1 | |
|---|---|---|
| 0 | Today last price | 1936.15 |
| 1 | Today Daily Change | 4.89 |
| 2 | Today Daily Change % | 0.25 |
| 3 | Today daily open | 1931.26 |
The pair remains strongly bullish on the daily timeframe. It trades above its 20 SMA @ 1871.86, 50 SMA 1815.68, 100 SMA @ 1746.33 and 200 SMA @ 1775.73.
| Trends | Trends.1 | |
|---|---|---|
| 0 | Daily SMA20 | 1871.86 |
| 1 | Daily SMA50 | 1815.68 |
| 2 | Daily SMA100 | 1746.33 |
| 3 | Daily SMA200 | 1775.73 |
The previous day high was 1935.62 while the previous day low was 1911.45. The daily 38.2% Fib levels comes at 1926.39, expected to provide support. Similarly, the daily 61.8% fib level is at 1920.68, expected to provide support.
Note the levels of interest below:
- Pivot support is noted at 1916.6, 1901.94, 1892.43
- Pivot resistance is noted at 1940.77, 1950.28, 1964.94
| Levels | Levels.1 |
|---|---|
| Previous Daily High | 1935.62 |
| Previous Daily Low | 1911.45 |
| Previous Weekly High | 1937.57 |
| Previous Weekly Low | 1896.63 |
| Previous Monthly High | 1833.38 |
| Previous Monthly Low | 1765.89 |
| Daily Fibonacci 38.2% | 1926.39 |
| Daily Fibonacci 61.8% | 1920.68 |
| Daily Pivot Point S1 | 1916.60 |
| Daily Pivot Point S2 | 1901.94 |
| Daily Pivot Point S3 | 1892.43 |
| Daily Pivot Point R1 | 1940.77 |
| Daily Pivot Point R2 | 1950.28 |
| Daily Pivot Point R3 | 1964.94 |
[/s2If]
Join Our Telegram Group
")


