#USDINR @ 81.6370 remains firmer for the second consecutive day, grinds near intraday top., @nehcap view: Further upside expected (Pivot Orderbook analysis)
…
This is a premium post.
[s2If !current_user_can(access_s2member_level4)]Please register for PREMIUM VERSION HERE to read full post below containing analysis. In case of any error or you think you are not able to read the full post below, please email us at support#nehcap.com [lwa][/s2If] [s2If current_user_can(access_s2member_level4)]
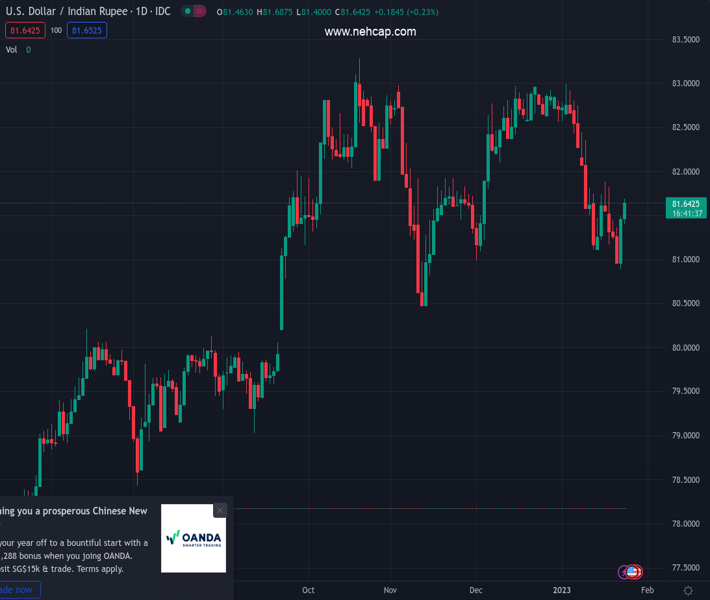
- USD/INR remains firmer for the second consecutive day, grinds near intraday top.
- Successful break of three-week-old descending trend line, upbeat oscillators suggest upside break of 100-DMA.
- Previous support line from early August 2022 acts as the last defense of USD/INR bears.
The pair currently trades last at 81.6370.
The previous day high was 81.5026 while the previous day low was 80.8822. The daily 38.2% Fib levels comes at 81.2656, expected to provide support. Similarly, the daily 61.8% fib level is at 81.1191, expected to provide support.
USD/INR holds onto the week-start breakout of the previously key resistance line as bulls flirt with the 81.65 level during an initial hour of the Indian trading session on Tuesday. Even so, the 100-DMA challenges the immediate upside moves near 81.80.
It’s worth noting, however, that the receding bearish bias of the USD/INR and the upbeat RSI (14) suggest further upside of the pair.
Hence, the quote is likely to overcome the immediate barrier to the north near 81.80. Following that, the 82.00 round figure will be the focus of the USD/INR buyers.
In a case where USD/INR remains firmer past 82.00, the support-turned-resistance line from early August, near 82.10 at the latest, will be crucial to watch as a sustained break of which might give control to the bulls.
On the flip side, the immediate support line from January 06, the previous resistance near 81.40, puts a floor under the USD/INR declines.
Should the quote remains weak past 81.40, the 81.00 round figure and the monthly low marked on Monday close to 80.90 may entertain the USD/INR bears.
If at all the Indian Rupee (INR) pair refreshes it’s monthly low, November’s trough surrounding 80.35 should be in the spotlight.
Trend: Further upside expected
Technical Levels: Supports and Resistances
USDINR currently trading at 81.6505 at the time of writing. Pair opened at 81.4804 and is trading with a change of 0.21% % .
| Overview | Overview.1 | |
|---|---|---|
| 0 | Today last price | 81.6505 |
| 1 | Today Daily Change | 0.1701 |
| 2 | Today Daily Change % | 0.21% |
| 3 | Today daily open | 81.4804 |
The pair is trading below its 20 Daily moving average @ 82.0146, below its 50 Daily moving average @ 82.0485 , below its 100 Daily moving average @ 81.7459 and above its 200 Daily moving average @ 80.1042
| Trends | Trends.1 | |
|---|---|---|
| 0 | Daily SMA20 | 82.0146 |
| 1 | Daily SMA50 | 82.0485 |
| 2 | Daily SMA100 | 81.7459 |
| 3 | Daily SMA200 | 80.1042 |
The previous day high was 81.5026 while the previous day low was 80.8822. The daily 38.2% Fib levels comes at 81.2656, expected to provide support. Similarly, the daily 61.8% fib level is at 81.1191, expected to provide support.
Note the levels of interest below:
- Pivot support is noted at 81.0742, 80.668, 80.4538
- Pivot resistance is noted at 81.6946, 81.9088, 82.315
| Levels | Levels.1 |
|---|---|
| Previous Daily High | 81.5026 |
| Previous Daily Low | 80.8822 |
| Previous Weekly High | 81.8865 |
| Previous Weekly Low | 80.9595 |
| Previous Monthly High | 84.2500 |
| Previous Monthly Low | 80.9855 |
| Daily Fibonacci 38.2% | 81.2656 |
| Daily Fibonacci 61.8% | 81.1191 |
| Daily Pivot Point S1 | 81.0742 |
| Daily Pivot Point S2 | 80.6680 |
| Daily Pivot Point S3 | 80.4538 |
| Daily Pivot Point R1 | 81.6946 |
| Daily Pivot Point R2 | 81.9088 |
| Daily Pivot Point R3 | 82.3150 |
[/s2If]
Join Our Telegram Group
")


