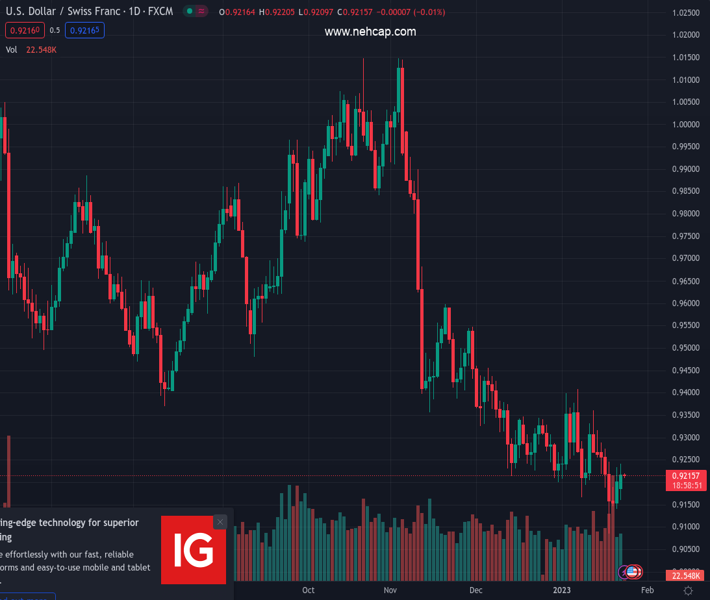
#USDCHF @ 0.92157 prints mild losses during the first daily fall in three. (Pivot Orderbook analysis)
…
This is a premium post.
[s2If !current_user_can(access_s2member_level4)]Please register for PREMIUM VERSION HERE to read full post below containing analysis. In case of any error or you think you are not able to read the full post below, please email us at support#nehcap.com [lwa][/s2If] [s2If current_user_can(access_s2member_level4)]
- USD/CHF prints mild losses during the first daily fall in three.
- Mixed sentiment, pre-data anxiety joins China-linked optimism to weigh on USD/CHF prices.
- US inflation expectations, hawkish central banks keep the buyers hopeful.
- Off in China, Fed’s blackout restrict immediate moves but US PMIs, Q4 GDP are more important for clear directions.
The pair currently trades last at 0.92157.
The previous day high was 0.9241 while the previous day low was 0.916. The daily 38.2% Fib levels comes at 0.921, expected to provide support. Similarly, the daily 61.8% fib level is at 0.9191, expected to provide support.
USD/CHF sellers return to the table, after a two-day absence, in early Tuesday. That said, the Swiss currency (CHF) pair’s latest weakness could be linked to the market’s consolidation amid a cautious mood ahead of the key data/events from Switzerland and the US. Also keeping the sellers hopeful could be the broad US Dollar weakness amid cautious optimism and sluggish performance.
That said, China’s Lunar New Year holidays join the pre-Federal Open Market Committee (FOMC) blackout period for the Fed policymakers to restrict the market’s immediate moves. Even so, the US Dollar fades from the previous day’s corrective bounce as softer US data on Monday backed dovish bias from the US central bank.
On Monday, softer prints of the US Conference Board’s Leading Index for December joined the lines of previous downbeat data from the US and signaled to ease inflation fears in the world’s largest economy, which in turn suggests less need for the Fed to be hawkish in February. It’s worth noting that the market players do expect a softer Fed rate hike in February and policy pivot afterward, which in turn weigh on the US Dollar.
Alternatively, the US inflation expectations, as per the 10-year and 5-year breakeven inflation rates from the St. Louis Federal Reserve (FRED) data, rise for the third consecutive day to 2.28% each and justify the pre-blackout hawkish Fed comments and challenge the sentiment.
Furthermore, news that the US confronts China over companies’ ties to the Russian war effort, shared by Bloomberg, joins the talks surrounding the US debt ceiling in the Senate to probe the market optimists.
Amid these plays, the S&P 500 Futures resist following Wall Street’s gains while retreating from the six-week high marked the previous day, making rounds to 4,030-35 at the latest. On the same line, the US 10-year and two-year Treasury bond yields snap three-day recovery moves by struggling around 3.51% and 4.21% by the press time.
Given the USD/CHF pair’s consolidation amid mixed clues, the upcoming Swiss trade numbers for December and the first readings of January’s S&P Global PMIs for the US will be important for intraday traders. However, major attention will be given to the US fourth-quarter (Q4) Gross Domestic Product (GDP) will be the key amid recession woes. Should the US data keep coming softer, the US Dollar could refresh the multi-month low marked earlier in January, which in turn will weigh on the USD/CHF prices.
A 12-day-old bearish channel restricts USD/CHF moves between 0.9035 and 0.9270.
Technical Levels: Supports and Resistances
USDCHF currently trading at 0.9214 at the time of writing. Pair opened at 0.9223 and is trading with a change of -0.10% % .
| Overview | Overview.1 | |
|---|---|---|
| 0 | Today last price | 0.9214 |
| 1 | Today Daily Change | -0.0009 |
| 2 | Today Daily Change % | -0.10% |
| 3 | Today daily open | 0.9223 |
The pair remains strongly bearish on the daily time frame. It trades below the 20 SMA @ 0.9257, 50 SMA 0.9341, 100 SMA @ 0.959 and 200 SMA @ 0.9638.
| Trends | Trends.1 | |
|---|---|---|
| 0 | Daily SMA20 | 0.9257 |
| 1 | Daily SMA50 | 0.9341 |
| 2 | Daily SMA100 | 0.9590 |
| 3 | Daily SMA200 | 0.9638 |
The previous day high was 0.9241 while the previous day low was 0.916. The daily 38.2% Fib levels comes at 0.921, expected to provide support. Similarly, the daily 61.8% fib level is at 0.9191, expected to provide support.
Note the levels of interest below:
- Pivot support is noted at 0.9175, 0.9127, 0.9094
- Pivot resistance is noted at 0.9256, 0.9289, 0.9337
| Levels | Levels.1 |
|---|---|
| Previous Daily High | 0.9241 |
| Previous Daily Low | 0.9160 |
| Previous Weekly High | 0.9288 |
| Previous Weekly Low | 0.9085 |
| Previous Monthly High | 0.9471 |
| Previous Monthly Low | 0.9201 |
| Daily Fibonacci 38.2% | 0.9210 |
| Daily Fibonacci 61.8% | 0.9191 |
| Daily Pivot Point S1 | 0.9175 |
| Daily Pivot Point S2 | 0.9127 |
| Daily Pivot Point S3 | 0.9094 |
| Daily Pivot Point R1 | 0.9256 |
| Daily Pivot Point R2 | 0.9289 |
| Daily Pivot Point R3 | 0.9337 |
[/s2If]
Join Our Telegram Group
")


