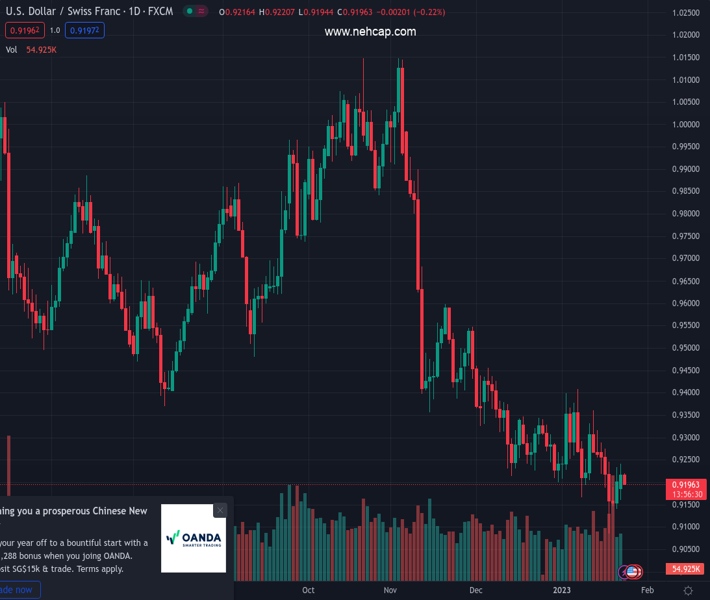
#USDCHF @ 0.91961 snaps a two-day winning streak amid the emergence of fresh selling around the USD. (Pivot Orderbook analysis)
…
This is a premium post.
[s2If !current_user_can(access_s2member_level4)]Please register for PREMIUM VERSION HERE to read full post below containing analysis. In case of any error or you think you are not able to read the full post below, please email us at support#nehcap.com [lwa][/s2If] [s2If current_user_can(access_s2member_level4)]
- USD/CHF snaps a two-day winning streak amid the emergence of fresh selling around the USD.
- Bets for a smaller Fed rate hike in February turn out to be a key factor weighing on the buck.
- A positive risk tone undermines the safe-haven CHF and might help limit losses for the major.
The pair currently trades last at 0.91961.
The previous day high was 0.9241 while the previous day low was 0.916. The daily 38.2% Fib levels comes at 0.921, expected to provide resistance. Similarly, the daily 61.8% fib level is at 0.9191, expected to provide support.
The USD/CHF pair edges lower on Tuesday and for now, seems to have stalled the recent recovery from sub-0.9100 levels, or its lowest level since November 2021 touched last week. The pair remains on the defensive through the early European session and is currently placed near the daily low, around the 0.9200 round-figure mark.
The US Dollar comes under some renewed selling pressure amid the prospects for a less aggressive policy tightening by the Fed and turns out to be a key factor acting as a headwind for the USD/CHF pair. In fact, investors seem convinced that the US central bank will soften its hawkish stance amid signs of easing inflationary pressures. Moreover, the current market pricing indicates a greater chance of a smaller 25 bps Fed rate hike move in February, which keeps a lid on the recent move up in the US Treasury bond yields and weighs on the USD.
The downside for the USD/CHF pair, meanwhile, remains cushioned, at least for the time being, amid a generally positive risk tone, which tends to undermine demand for the safe-haven Swiss franc (CHF). Nevertheless, the fundamental backdrop seems tilted firmly in favour of bearish traders and supports prospects for an extension of the recent downward trajectory witnessed since early November 2022. Hence, any intraday positive move is more likely to attract fresh sellers at higher levels and runs the risk of fizzling out rather quickly.
Market participants now look forward to the US economic docket, featuring the release of flash PMI prints and the Richmond Manufacturing Index. This, along with the US bond yields, will influence the USD price dynamics and provide some impetus to the USD/CHF pair. Apart from this, the broader risk sentiment might contribute to producing short-term opportunities. Traders, however, might refrain from placing aggressive bets and prefer to move to the sidelines as the focus remains glued to the FOMC monetary policy meeting, scheduled next week.
Technical Levels: Supports and Resistances
USDCHF currently trading at 0.9204 at the time of writing. Pair opened at 0.9223 and is trading with a change of -0.21 % .
| Overview | Overview.1 | |
|---|---|---|
| 0 | Today last price | 0.9204 |
| 1 | Today Daily Change | -0.0019 |
| 2 | Today Daily Change % | -0.2100 |
| 3 | Today daily open | 0.9223 |
The pair remains strongly bearish on the daily time frame. It trades below the 20 SMA @ 0.9257, 50 SMA 0.9341, 100 SMA @ 0.959 and 200 SMA @ 0.9638.
| Trends | Trends.1 | |
|---|---|---|
| 0 | Daily SMA20 | 0.9257 |
| 1 | Daily SMA50 | 0.9341 |
| 2 | Daily SMA100 | 0.9590 |
| 3 | Daily SMA200 | 0.9638 |
The previous day high was 0.9241 while the previous day low was 0.916. The daily 38.2% Fib levels comes at 0.921, expected to provide resistance. Similarly, the daily 61.8% fib level is at 0.9191, expected to provide support.
Note the levels of interest below:
- Pivot support is noted at 0.9175, 0.9127, 0.9094
- Pivot resistance is noted at 0.9256, 0.9289, 0.9337
| Levels | Levels.1 |
|---|---|
| Previous Daily High | 0.9241 |
| Previous Daily Low | 0.9160 |
| Previous Weekly High | 0.9288 |
| Previous Weekly Low | 0.9085 |
| Previous Monthly High | 0.9471 |
| Previous Monthly Low | 0.9201 |
| Daily Fibonacci 38.2% | 0.9210 |
| Daily Fibonacci 61.8% | 0.9191 |
| Daily Pivot Point S1 | 0.9175 |
| Daily Pivot Point S2 | 0.9127 |
| Daily Pivot Point S3 | 0.9094 |
| Daily Pivot Point R1 | 0.9256 |
| Daily Pivot Point R2 | 0.9289 |
| Daily Pivot Point R3 | 0.9337 |
[/s2If]
Join Our Telegram Group
")


