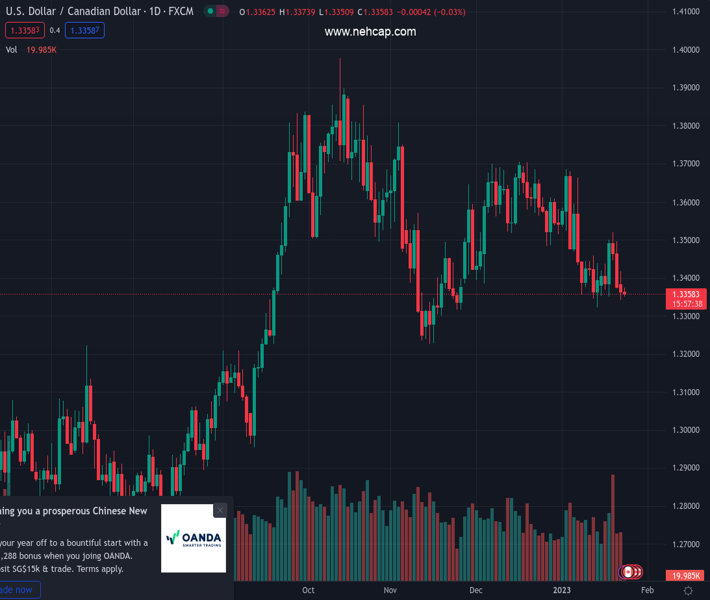
#USDCAD @ 1.33594 fades bounce off intraday low during four-day downtrend. (Pivot Orderbook analysis)
…
This is a premium post.
[s2If !current_user_can(access_s2member_level4)]Please register for PREMIUM VERSION HERE to read full post below containing analysis. In case of any error or you think you are not able to read the full post below, please email us at support#nehcap.com [lwa][/s2If] [s2If current_user_can(access_s2member_level4)]
- USD/CAD fades bounce off intraday low during four-day downtrend.
- Oil price struggles to defend gains amid mixed concerns.
- Hawkish hopes of Bank of Canada, talks surrounding Fed policy pivot keep sellers hopeful.
- Preliminary readings of US S&P Global PMIs for January will be crucial ahead of BoC interest rate decision.
The pair currently trades last at 1.33594.
The previous day high was 1.3418 while the previous day low was 1.3342. The daily 38.2% Fib levels comes at 1.3371, expected to provide resistance. Similarly, the daily 61.8% fib level is at 1.3389, expected to provide resistance.
USD/CAD slides to 1.3350 as bears keep the reins for the fourth consecutive day heading into Tuesday’s European session.
In doing so, the Loonie pair cheers the broad US Dollar weakness, as well as a slow grind to the north in prices of Canada’s key export item, namely WTI crude oil, ahead of monthly activity data from the US. It’s worth noting that Wednesday’s Bank of Canada (BoC) monetary policy decision will be eyed closely by the pair traders amid talks surrounding a policy pivot.
That said, WTI crude oil pares intraday gains near $81.70 after a softer start to the week. Even so, black gold remains around the seven-week high amid hopes of China-linked demand. It should be observed that the latest talks surrounding the US readiness to use Special Petroleum Reserves (SPR) in the need weigh on the quote.
Elsewhere, the struggles between the US and China surrounding the Beijing-based companies’ ties to the Russian war effort join the fears of economic recession to weigh on the market sentiment and probe USD/CAD bears. Though, mixed figures of the Canadian housing data published the previous day joined the downbeat US Conference Board’s Leading Index and put a floor under the prices.
On a broader front, the absence of Fed policymakers’ talks ahead of the February meeting and the Lunar New Year holidays in China restricts the market moves, as well as limit USD/CAD pair’s momentum.
Amid these plays, the S&P 500 Futures resist following Wall Street’s gains while retreating from the six-week high marked the previous day, making rounds to 4,030-35 at the latest. On the same line, the US 10-year and two-year Treasury bond yields snap three-day recovery moves by struggling around 3.51% and 4.21% by the press time.
To break the monotony, USD/CAD traders may take clues from the first readings of January’s S&P Global PMIs and the fourth-quarter (Q4) Gross Domestic Product (GDP). However, major attention will be given to Wednesday’s BoC where the Canadian central bank is up for 0.25% rate hike. More importantly, hints for further rate hikes will be closely observed to determine further downside bias for the Loonie pair.
Having failed to cross the 100-DMA, around 1.3515 by the press time, the USD/CAD bears poke a 10-week-old support line, near 1.3340 at the latest, to confirm further downside of the Loonie pair.
Technical Levels: Supports and Resistances
USDCAD currently trading at 1.3358 at the time of writing. Pair opened at 1.3374 and is trading with a change of -0.12% % .
| Overview | Overview.1 | |
|---|---|---|
| 0 | Today last price | 1.3358 |
| 1 | Today Daily Change | -0.0016 |
| 2 | Today Daily Change % | -0.12% |
| 3 | Today daily open | 1.3374 |
The pair is trading below its 20 Daily moving average @ 1.3474, below its 50 Daily moving average @ 1.3501 , below its 100 Daily moving average @ 1.3515 and above its 200 Daily moving average @ 1.3194
| Trends | Trends.1 | |
|---|---|---|
| 0 | Daily SMA20 | 1.3474 |
| 1 | Daily SMA50 | 1.3501 |
| 2 | Daily SMA100 | 1.3515 |
| 3 | Daily SMA200 | 1.3194 |
The previous day high was 1.3418 while the previous day low was 1.3342. The daily 38.2% Fib levels comes at 1.3371, expected to provide resistance. Similarly, the daily 61.8% fib level is at 1.3389, expected to provide resistance.
Note the levels of interest below:
- Pivot support is noted at 1.3338, 1.3302, 1.3262
- Pivot resistance is noted at 1.3414, 1.3453, 1.3489
| Levels | Levels.1 |
|---|---|
| Previous Daily High | 1.3418 |
| Previous Daily Low | 1.3342 |
| Previous Weekly High | 1.3521 |
| Previous Weekly Low | 1.3351 |
| Previous Monthly High | 1.3705 |
| Previous Monthly Low | 1.3385 |
| Daily Fibonacci 38.2% | 1.3371 |
| Daily Fibonacci 61.8% | 1.3389 |
| Daily Pivot Point S1 | 1.3338 |
| Daily Pivot Point S2 | 1.3302 |
| Daily Pivot Point S3 | 1.3262 |
| Daily Pivot Point R1 | 1.3414 |
| Daily Pivot Point R2 | 1.3453 |
| Daily Pivot Point R3 | 1.3489 |
[/s2If]
Join Our Telegram Group
")


