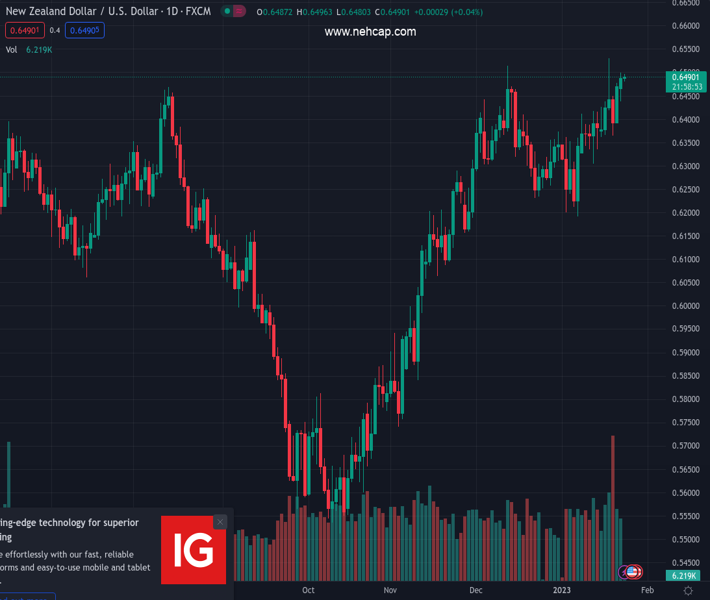
#NZDUSD @ 0.64922 is seeking more upside above 0.6500 as the risk profile is supporting risk-perceived assets. (Pivot Orderbook analysis)
…
This is a premium post.
[s2If !current_user_can(access_s2member_level4)]Please register for PREMIUM VERSION HERE to read full post below containing analysis. In case of any error or you think you are not able to read the full post below, please email us at support#nehcap.com [lwa][/s2If] [s2If current_user_can(access_s2member_level4)]
- NZD/USD is seeking more upside above 0.6500 as the risk profile is supporting risk-perceived assets.
- US inflation softening resulted in a decline in the US Dollar Index below 101.60.
- Investors are awaiting the release of the US S&P PMI and NZ Inflation data for fresh cues.
The pair currently trades last at 0.64922.
The previous day high was 0.6476 while the previous day low was 0.6391. The daily 38.2% Fib levels comes at 0.6444, expected to provide support. Similarly, the daily 61.8% fib level is at 0.6423, expected to provide support.
The NZD/USD pair is aiming to extend its upside journey above the psychological resistance of 0.6500 in the early Asian session. The kiwi asset is eyeing a recovery extension amid a cheerful market mood. Soaring expectations of a further slowdown in the pace of policy tightening by the Federal Reserve (Fed) is infusing strength into the risk-sensitive assets.
In early Tokyo, S&P500 futures are showing marginal losses after a bullish Monday. Caution is stemming, however, the overall market sentiment is strictly positive. Investors’ risk appetite is still solid as meaningful softening United States inflation is setting grounds for a deceleration in the interest rates hiking pace.
The US Dollar Index (DXY) has dropped to near 101.60 after sensing selling pressure while attempting to cross the critical resistance of 101.87 after commentary from US Treasury Secretary Janet Yellen. US Yeller cited on Monday that overall, she has a “good feeling that inflation is coming down.” However, it reiterated the fact that the “US labor market is still very tight,”
The next move that might trigger volatility in the US Dollar is the release of the preliminary United States S&P PMI (Jan) data, which is seen on Tuesday. Investors should brace for a contraction in economic activities. The Manufacturing PMI is seen lower at 46.1 while the Services PMI might contract to 44.5.
On the kiwi front, the New Zealand Dollar will display a power-pack action after the release of Wednesday’s Consumer Price Index (CPI) data. Annual Consumer Price Index (CPI) data for the fourth quarter of CY2022 is seen declining marginally to 7.1% from the former release of 7.2%. On a quarterly basis, the inflation rate might trim to 1.3% from the prior release of 2.2%.
Technical Levels: Supports and Resistances
NZDUSD currently trading at 0.6496 at the time of writing. Pair opened at 0.6471 and is trading with a change of 0.39 % .
| Overview | Overview.1 | |
|---|---|---|
| 0 | Today last price | 0.6496 |
| 1 | Today Daily Change | 0.0025 |
| 2 | Today Daily Change % | 0.3900 |
| 3 | Today daily open | 0.6471 |
The pair remains strongly bullish on the daily timeframe. It trades above its 20 SMA @ 0.6351, 50 SMA 0.6311, 100 SMA @ 0.6064 and 200 SMA @ 0.6201.
| Trends | Trends.1 | |
|---|---|---|
| 0 | Daily SMA20 | 0.6351 |
| 1 | Daily SMA50 | 0.6311 |
| 2 | Daily SMA100 | 0.6064 |
| 3 | Daily SMA200 | 0.6201 |
The previous day high was 0.6476 while the previous day low was 0.6391. The daily 38.2% Fib levels comes at 0.6444, expected to provide support. Similarly, the daily 61.8% fib level is at 0.6423, expected to provide support.
Note the levels of interest below:
- Pivot support is noted at 0.6416, 0.6361, 0.6331
- Pivot resistance is noted at 0.6501, 0.6531, 0.6586
| Levels | Levels.1 |
|---|---|
| Previous Daily High | 0.6476 |
| Previous Daily Low | 0.6391 |
| Previous Weekly High | 0.6531 |
| Previous Weekly Low | 0.6361 |
| Previous Monthly High | 0.6514 |
| Previous Monthly Low | 0.6230 |
| Daily Fibonacci 38.2% | 0.6444 |
| Daily Fibonacci 61.8% | 0.6423 |
| Daily Pivot Point S1 | 0.6416 |
| Daily Pivot Point S2 | 0.6361 |
| Daily Pivot Point S3 | 0.6331 |
| Daily Pivot Point R1 | 0.6501 |
| Daily Pivot Point R2 | 0.6531 |
| Daily Pivot Point R3 | 0.6586 |
[/s2If]
Join Our Telegram Group
")


