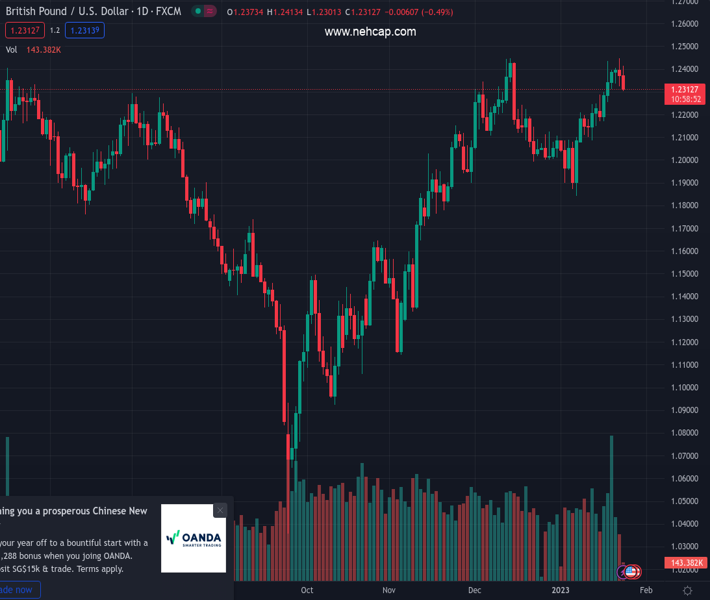
#GBPUSD @ 1.23182 drifts into negative territory for the second successive day on Tuesday. (Pivot Orderbook analysis)
…
This is a premium post.
[s2If !current_user_can(access_s2member_level4)]Please register for PREMIUM VERSION HERE to read full post below containing analysis. In case of any error or you think you are not able to read the full post below, please email us at support#nehcap.com [lwa][/s2If] [s2If current_user_can(access_s2member_level4)]
- GBP/USD drifts into negative territory for the second successive day on Tuesday.
- The USD attracts haven flows amid looming recession risks and exerts pressure.
- Expectations that the BoE will continue raising rates should limit deeper losses.
The pair currently trades last at 1.23182.
The previous day high was 1.2448 while the previous day low was 1.2324. The daily 38.2% Fib levels comes at 1.2371, expected to provide resistance. Similarly, the daily 61.8% fib level is at 1.2401, expected to provide resistance.
The GBP/USD pair attracts some sellers following an early uptick to the 1.2415 area and turns lower for the second successive day on Tuesday. Spot prices retreat further from the highest level since June 2022 touched on Monday and drop to the 1.2300 round-figure mark, or a four-day low during the first half of the European session.
The US Dollar stages a modest recovery from a nine-month low and turns out to be a key factor exerting some downward pressure on the GBP/USD pair. The market sentiment remains fragile amid worries about the economic headwinds stemming from the worst yet COVID-19 outbreak in China. Furthermore, the protracted Russia-Ukraine war has been fueling recession fears. This, in turn, tempers investors’ appetite for riskier assets and drives some haven flows towards traditional safe-haven assets, including the buck.
The British Pound, on the other hand, is pressured by weaker PMI prints, which showed that business activity in both manufacturing and services sectors contracted in January. However, speculations that elevated consumer inflation will maintain pressure on the Bank of England (BoE) to continue raising interest rates could lend some support to the Sterling. Apart from this, rising bets for a smaller 25 bps Fed rate hike in February might cap the USD and help limit deeper losses for the GBP/USD pair.
Hence, it will be prudent to wait for strong follow-through selling before confirming that spot prices have topped out in the near term and positioning for any meaningful corrective decline. Traders now look forward to the US economic docket, featuring the release of the flash PMI prints and the Richmond Manufacturing Index. This, along with the US bond yields and the broader risk sentiment, will influence the USD price dynamics and produce short-term trading opportunities around the GBP/USD pair.
Technical Levels: Supports and Resistances
GBPUSD currently trading at 1.2308 at the time of writing. Pair opened at 1.2373 and is trading with a change of -0.53 % .
| Overview | Overview.1 | |
|---|---|---|
| 0 | Today last price | 1.2308 |
| 1 | Today Daily Change | -0.0065 |
| 2 | Today Daily Change % | -0.5300 |
| 3 | Today daily open | 1.2373 |
The pair remains strongly bullish on the daily timeframe. It trades above its 20 SMA @ 1.2159, 50 SMA 1.2123, 100 SMA @ 1.1732 and 200 SMA @ 1.1975.
| Trends | Trends.1 | |
|---|---|---|
| 0 | Daily SMA20 | 1.2159 |
| 1 | Daily SMA50 | 1.2123 |
| 2 | Daily SMA100 | 1.1732 |
| 3 | Daily SMA200 | 1.1975 |
The previous day high was 1.2448 while the previous day low was 1.2324. The daily 38.2% Fib levels comes at 1.2371, expected to provide resistance. Similarly, the daily 61.8% fib level is at 1.2401, expected to provide resistance.
Note the levels of interest below:
- Pivot support is noted at 1.2315, 1.2257, 1.2191
- Pivot resistance is noted at 1.244, 1.2506, 1.2564
| Levels | Levels.1 |
|---|---|
| Previous Daily High | 1.2448 |
| Previous Daily Low | 1.2324 |
| Previous Weekly High | 1.2436 |
| Previous Weekly Low | 1.2169 |
| Previous Monthly High | 1.2447 |
| Previous Monthly Low | 1.1992 |
| Daily Fibonacci 38.2% | 1.2371 |
| Daily Fibonacci 61.8% | 1.2401 |
| Daily Pivot Point S1 | 1.2315 |
| Daily Pivot Point S2 | 1.2257 |
| Daily Pivot Point S3 | 1.2191 |
| Daily Pivot Point R1 | 1.2440 |
| Daily Pivot Point R2 | 1.2506 |
| Daily Pivot Point R3 | 1.2564 |
[/s2If]
Join Our Telegram Group
")


