#EURUSD @ 1.08738 picks up bids to reverse pullback from nine-month high, bounces off 21-EMA., @nehcap view: Limited upside expected (Pivot Orderbook analysis)
…
This is a premium post.
[s2If !current_user_can(access_s2member_level4)]Please register for PREMIUM VERSION HERE to read full post below containing analysis. In case of any error or you think you are not able to read the full post below, please email us at support#nehcap.com [lwa][/s2If] [s2If current_user_can(access_s2member_level4)]
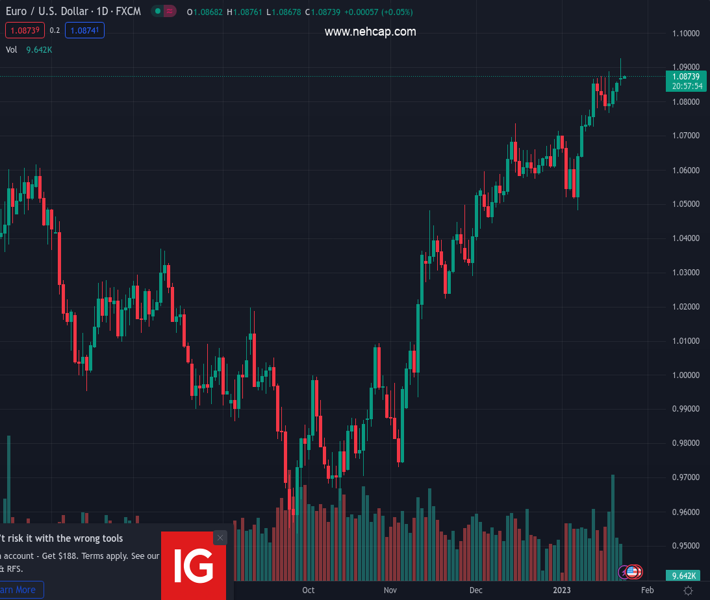
- EUR/USD picks up bids to reverse pullback from nine-month high, bounces off 21-EMA.
- Impending bear cross on MACD, RSI divergence tease sellers.
- Ascending trend line from mid-December appears a tough nut to crack for bulls.
The pair currently trades last at 1.08738.
The previous day high was 1.0927 while the previous day low was 1.0846. The daily 38.2% Fib levels comes at 1.0896, expected to provide resistance. Similarly, the daily 61.8% fib level is at 1.0877, expected to provide resistance.
EUR/USD resumes run-up towards the short-term key hurdle as it rises to 1.0875 during early Tuesday, following a retreat from the nine-month high amid late trading hours of the previous day. In doing so, the major currency pair bounces off the 21-Exponential Moving Average (EMA), around 1.0850 by the press time.
However, an upward-sloping resistance line from December 15, 2022, close to 1.0920 at the latest, challenges the EUR/USD pair’s immediate upside.
In addition to the immediate resistance line, the looming bear cross on the MACD and the bearish RSI divergence, a condition where the higher high in price doesn’t accompany the higher high in the indicator, also challenge the EUR/USD buyers.
It should be noted that the April 2022 peak surrounding 1.0940 acts as an additional upside hurdle, other than the 1.0920, to challenge the pair buyers before directing them towards the 1.1000 round figure.
Alternatively, the 21-EMA and the 50-EMA restrict immediate EUR/USD downside near 1.0850 and 1.0820 respectively.
Following that, the late December 2022 high near 1.0715 and the 1.0700 could please the pair sellers.
In a case where the EUR/USD pair remains bearish past 1.0700, an ascending support line from November 21, close to 1.0665 at the latest, will act as the last defense of the buyers.
Trend: Limited upside expected
Technical Levels: Supports and Resistances
EURUSD currently trading at 1.0872 at the time of writing. Pair opened at 1.0868 and is trading with a change of 0.04% % .
| Overview | Overview.1 | |
|---|---|---|
| 0 | Today last price | 1.0872 |
| 1 | Today Daily Change | 0.0004 |
| 2 | Today Daily Change % | 0.04% |
| 3 | Today daily open | 1.0868 |
The pair remains strongly bullish on the daily timeframe. It trades above its 20 SMA @ 1.0724, 50 SMA 1.0582, 100 SMA @ 1.0241 and 200 SMA @ 1.031.
| Trends | Trends.1 | |
|---|---|---|
| 0 | Daily SMA20 | 1.0724 |
| 1 | Daily SMA50 | 1.0582 |
| 2 | Daily SMA100 | 1.0241 |
| 3 | Daily SMA200 | 1.0310 |
The previous day high was 1.0927 while the previous day low was 1.0846. The daily 38.2% Fib levels comes at 1.0896, expected to provide resistance. Similarly, the daily 61.8% fib level is at 1.0877, expected to provide resistance.
Note the levels of interest below:
- Pivot support is noted at 1.0834, 1.08, 1.0754
- Pivot resistance is noted at 1.0915, 1.0961, 1.0995
| Levels | Levels.1 |
|---|---|
| Previous Daily High | 1.0927 |
| Previous Daily Low | 1.0846 |
| Previous Weekly High | 1.0888 |
| Previous Weekly Low | 1.0766 |
| Previous Monthly High | 1.0736 |
| Previous Monthly Low | 1.0393 |
| Daily Fibonacci 38.2% | 1.0896 |
| Daily Fibonacci 61.8% | 1.0877 |
| Daily Pivot Point S1 | 1.0834 |
| Daily Pivot Point S2 | 1.0800 |
| Daily Pivot Point S3 | 1.0754 |
| Daily Pivot Point R1 | 1.0915 |
| Daily Pivot Point R2 | 1.0961 |
| Daily Pivot Point R3 | 1.0995 |
[/s2If]
Join Our Telegram Group
")


