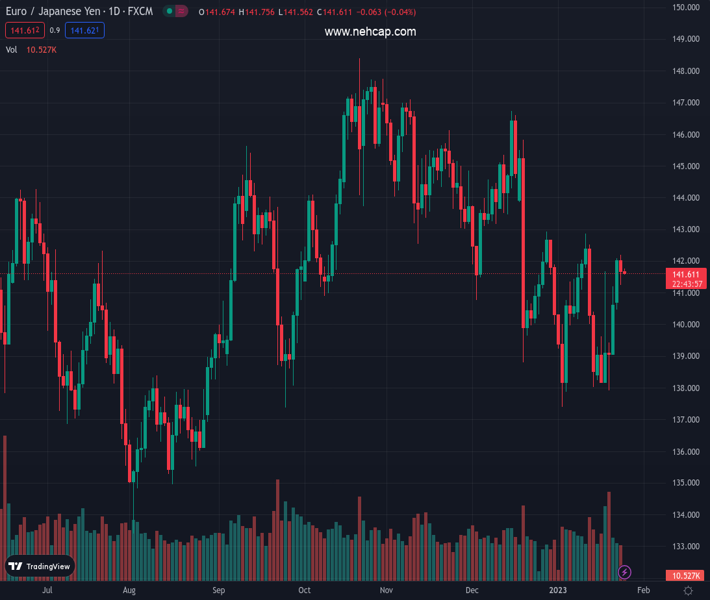
#EURJPY @ 141.571 forms a hanging man as it fails to conquer the 100-day EMA, suggesting further downside is expected. (Pivot Orderbook analysis)
…
This is a premium post.
[s2If !current_user_can(access_s2member_level4)]Please register for PREMIUM VERSION HERE to read full post below containing analysis. In case of any error or you think you are not able to read the full post below, please email us at support#nehcap.com [lwa][/s2If] [s2If current_user_can(access_s2member_level4)]
- EUR/JPY forms a hanging man as it fails to conquer the 100-day EMA, suggesting further downside is expected.
- EUR/JPY Price Analysis: The pair would be bearish below 141.00; otherwise, it could challenge 142.00.
The pair currently trades last at 141.571.
The previous day high was 142.08 while the previous day low was 140.47. The daily 38.2% Fib levels comes at 141.47, expected to provide support. Similarly, the daily 61.8% fib level is at 141.09, expected to provide support.
EUR/JPY snapped two days of consecutive gains and retraced some of its gains as the EUR/JPY clashed with the 100-day Exponential Moving Average (EMA) at 141.83 but could not crack it. Therefore, the cross dived beneath the latter, with Tuesday’s session closing at 141.65. As the Asian session begins, the EUR/JPY is trading at 141.62, registering minuscule losses of 0.04%.
The EUR/JPY remains sideways, even though the pair reached a two-week high at 142.20. Although the EUR/JPY recovered 2% since last Friday, Tuesday’s price action formed a hanging man, suggesting the exchange rates would aim lower. Nevertheless, the EUR/JPY would face a confluence of support areas, like two previous downslope resistance trendlines, around 141.00. Once those trendlines are broken, the next zone of demand tested would be the 20-day EMA at 140.79, ahead of the 200-day EMA at 140.20
However, if buyers can hold above 141.00, a retest to the 100-day EMA at 141.73 is on the cards. A decisive break would expose the 142.00 psychological figure, followed by the January 11 high at 142.85.
Technical Levels: Supports and Resistances
EURJPY currently trading at 141.7 at the time of writing. Pair opened at 142.04 and is trading with a change of -0.24 % .
| Overview | Overview.1 | |
|---|---|---|
| 0 | Today last price | 141.70 |
| 1 | Today Daily Change | -0.34 |
| 2 | Today Daily Change % | -0.24 |
| 3 | Today daily open | 142.04 |
The pair is trading above its 20 Daily moving average @ 140.48, below its 50 Daily moving average @ 142.39 , below its 100 Daily moving average @ 143.16 and above its 200 Daily moving average @ 140.8
| Trends | Trends.1 | |
|---|---|---|
| 0 | Daily SMA20 | 140.48 |
| 1 | Daily SMA50 | 142.39 |
| 2 | Daily SMA100 | 143.16 |
| 3 | Daily SMA200 | 140.80 |
The previous day high was 142.08 while the previous day low was 140.47. The daily 38.2% Fib levels comes at 141.47, expected to provide support. Similarly, the daily 61.8% fib level is at 141.09, expected to provide support.
Note the levels of interest below:
- Pivot support is noted at 140.98, 139.92, 139.37
- Pivot resistance is noted at 142.59, 143.14, 144.2
| Levels | Levels.1 |
|---|---|
| Previous Daily High | 142.08 |
| Previous Daily Low | 140.47 |
| Previous Weekly High | 141.69 |
| Previous Weekly Low | 137.92 |
| Previous Monthly High | 146.73 |
| Previous Monthly Low | 138.80 |
| Daily Fibonacci 38.2% | 141.47 |
| Daily Fibonacci 61.8% | 141.09 |
| Daily Pivot Point S1 | 140.98 |
| Daily Pivot Point S2 | 139.92 |
| Daily Pivot Point S3 | 139.37 |
| Daily Pivot Point R1 | 142.59 |
| Daily Pivot Point R2 | 143.14 |
| Daily Pivot Point R3 | 144.20 |
[/s2If]
Join Our Telegram Group
")


