#AUDUSD @ 0.70334 picks up bids to renew intraday high during three-day uptrend., @nehcap view: Limited upside expected (Pivot Orderbook analysis)
…
This is a premium post.
[s2If !current_user_can(access_s2member_level4)]Please register for PREMIUM VERSION HERE to read full post below containing analysis. In case of any error or you think you are not able to read the full post below, please email us at support#nehcap.com [lwa][/s2If] [s2If current_user_can(access_s2member_level4)]
- AUD/USD picks up bids to renew intraday high during three-day uptrend.
- Convergence of one-week-old bullish channel’s top line, ascending trend line from December 01 challenge buyers.
- Nearly overbought RSI restricts further upside of the Aussie pair.
- Bears remain off the table unless witnessing clear downside break of 100-SMA.
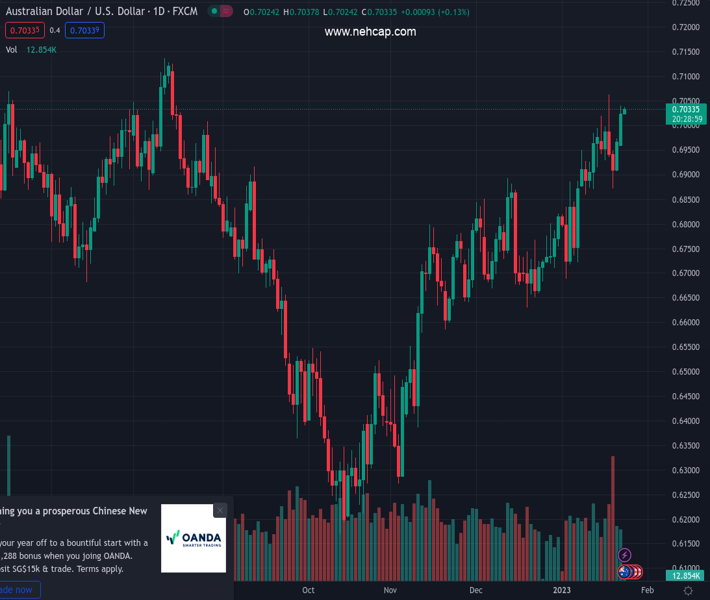
The pair currently trades last at 0.70334.
The previous day high was 0.704 while the previous day low was 0.696. The daily 38.2% Fib levels comes at 0.7009, expected to provide support. Similarly, the daily 61.8% fib level is at 0.699, expected to provide support.
AUD/USD bulls keep the reins for the third consecutive day around 0.7030-35 during early Tuesday. In doing so, the Aussie pair stays inside a one-week-long ascending trend channel while justifying a firmer RSI (14).
It should be noted, however, that a seven-week-old upward-sloping resistance line joins the stated bullish channel’s top line near 0.7050-55 to pose a serious threat to the current advances.
Adding strength to the fears of the AUD/USD bulls is the RSI (14) line that approaches the overbought territory and suggests a pullback.
In a case where the Aussie buyers manage to cross the 0.7055 resistance confluence, the previous weekly high near 0.7065 may act as the last defense of the bears before directing the quote towards the August 2022 peak surrounding 0.7140.
Alternatively, pullback moves may initially aim for the 0.7000 psychological magnet and remain less harmful to the bullish trend unless breaking the short-term rising channel’s support line, close to 0.6970 at the latest.
Following that, the 100-SMA and the previous monthly high could challenge the AUD/USD pair sellers around 0.6900 and 0.6890 in that order before giving them control.
Trend: Limited upside expected
Technical Levels: Supports and Resistances
AUDUSD currently trading at 0.7036 at the time of writing. Pair opened at 0.7026 and is trading with a change of 0.14% % .
| Overview | Overview.1 | |
|---|---|---|
| 0 | Today last price | 0.7036 |
| 1 | Today Daily Change | 0.0010 |
| 2 | Today Daily Change % | 0.14% |
| 3 | Today daily open | 0.7026 |
The pair remains strongly bullish on the daily timeframe. It trades above its 20 SMA @ 0.6875, 50 SMA 0.6786, 100 SMA @ 0.6643 and 200 SMA @ 0.6818.
| Trends | Trends.1 | |
|---|---|---|
| 0 | Daily SMA20 | 0.6875 |
| 1 | Daily SMA50 | 0.6786 |
| 2 | Daily SMA100 | 0.6643 |
| 3 | Daily SMA200 | 0.6818 |
The previous day high was 0.704 while the previous day low was 0.696. The daily 38.2% Fib levels comes at 0.7009, expected to provide support. Similarly, the daily 61.8% fib level is at 0.699, expected to provide support.
Note the levels of interest below:
- Pivot support is noted at 0.6978, 0.6929, 0.6898
- Pivot resistance is noted at 0.7058, 0.7089, 0.7137
| Levels | Levels.1 |
|---|---|
| Previous Daily High | 0.7040 |
| Previous Daily Low | 0.6960 |
| Previous Weekly High | 0.7064 |
| Previous Weekly Low | 0.6872 |
| Previous Monthly High | 0.6893 |
| Previous Monthly Low | 0.6629 |
| Daily Fibonacci 38.2% | 0.7009 |
| Daily Fibonacci 61.8% | 0.6990 |
| Daily Pivot Point S1 | 0.6978 |
| Daily Pivot Point S2 | 0.6929 |
| Daily Pivot Point S3 | 0.6898 |
| Daily Pivot Point R1 | 0.7058 |
| Daily Pivot Point R2 | 0.7089 |
| Daily Pivot Point R3 | 0.7137 |
[/s2If]
Join Our Telegram Group
")


