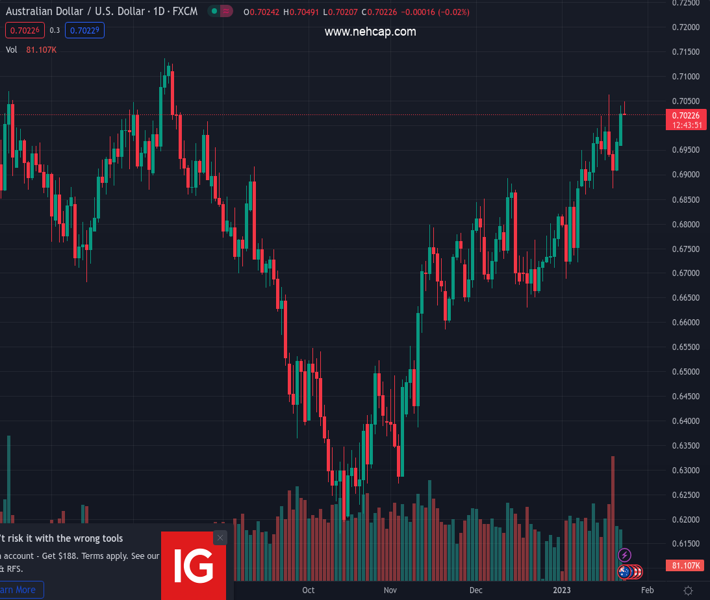
#AUDUSD @ 0.70231 fails to preserve its modest intraday gains and retreats from the mid-0.7000s. (Pivot Orderbook analysis)
…
This is a premium post.
[s2If !current_user_can(access_s2member_level4)]Please register for PREMIUM VERSION HERE to read full post below containing analysis. In case of any error or you think you are not able to read the full post below, please email us at support#nehcap.com [lwa][/s2If] [s2If current_user_can(access_s2member_level4)]
- AUD/USD fails to preserve its modest intraday gains and retreats from the mid-0.7000s.
- Looming recession risks weigh on investors’ sentiment and cap the risk-sensitive Aussie.
- Bets for smaller Fed rate hikes weigh on the USD and should help limit losses for the pair.
- Traders now look to the US economic data for some impetus ahead of the Australian CPI.
The pair currently trades last at 0.70231.
The previous day high was 0.704 while the previous day low was 0.696. The daily 38.2% Fib levels comes at 0.7009, expected to provide support. Similarly, the daily 61.8% fib level is at 0.699, expected to provide support.
The AUD/USD pair struggles to capitalize on its modest intraday gains and retreats a few pips from the daily peak, around the mid-0.7000s touched during the early European session. Spot prices, however, manage to hold above the 0.7000 psychological mark and seem poised to prolong the recent appreciating move witnessed over the past three months or so.
A softer risk tone – amid looming global recession risks – assists the safe-haven US Dollar to trim a part of its intraday losses and acts as a headwind for the AUD/USD pair. That said, any meaningful USD recovery remains elusive amid growing acceptance that the Fed will soften its hawkish stance. In fact, the markets have been pricing in a greater chance of a smaller 25 bps Fed rate hike move in February, which keeps the US Treasury bond yields depressed and should cap the greenback.
Furthermore, rising odds for an additional rate hike by the Reserve Bank of Australia (RBA) in February might continue to lend support to the Aussie and limit the downside for the AUD/USD pair. The bets were lifted by the Australian consumer inflation figures released earlier this month, which showed that the headline CPI re-accelerated to the 7.3% YoY rate – a 32-year-high – in November. Hence, the market focus will remain glued to the fourth-quarter Australian CPI report, due on Wednesday.
In the meantime, traders will take cues from the US economic docket – featuring the release of the flash PMI prints and the Richmond Manufacturing Index. This, along with the US bond yields and the broader risk sentiment, will influence the USD price dynamics and provide some impetus to the AUD/USD pair. Nevertheless, the fundamental backdrop remains tilted firming in favour of bullish traders, suggesting that any pullback might still be seen as a buying opportunity and remain limited.
Technical Levels: Supports and Resistances
AUDUSD currently trading at 0.7028 at the time of writing. Pair opened at 0.7026 and is trading with a change of 0.03 % .
| Overview | Overview.1 | |
|---|---|---|
| 0 | Today last price | 0.7028 |
| 1 | Today Daily Change | 0.0002 |
| 2 | Today Daily Change % | 0.0300 |
| 3 | Today daily open | 0.7026 |
The pair remains strongly bullish on the daily timeframe. It trades above its 20 SMA @ 0.6875, 50 SMA 0.6786, 100 SMA @ 0.6643 and 200 SMA @ 0.6818.
| Trends | Trends.1 | |
|---|---|---|
| 0 | Daily SMA20 | 0.6875 |
| 1 | Daily SMA50 | 0.6786 |
| 2 | Daily SMA100 | 0.6643 |
| 3 | Daily SMA200 | 0.6818 |
The previous day high was 0.704 while the previous day low was 0.696. The daily 38.2% Fib levels comes at 0.7009, expected to provide support. Similarly, the daily 61.8% fib level is at 0.699, expected to provide support.
Note the levels of interest below:
- Pivot support is noted at 0.6978, 0.6929, 0.6898
- Pivot resistance is noted at 0.7058, 0.7089, 0.7137
| Levels | Levels.1 |
|---|---|
| Previous Daily High | 0.7040 |
| Previous Daily Low | 0.6960 |
| Previous Weekly High | 0.7064 |
| Previous Weekly Low | 0.6872 |
| Previous Monthly High | 0.6893 |
| Previous Monthly Low | 0.6629 |
| Daily Fibonacci 38.2% | 0.7009 |
| Daily Fibonacci 61.8% | 0.6990 |
| Daily Pivot Point S1 | 0.6978 |
| Daily Pivot Point S2 | 0.6929 |
| Daily Pivot Point S3 | 0.6898 |
| Daily Pivot Point R1 | 0.7058 |
| Daily Pivot Point R2 | 0.7089 |
| Daily Pivot Point R3 | 0.7137 |
[/s2If]
Join Our Telegram Group
")


