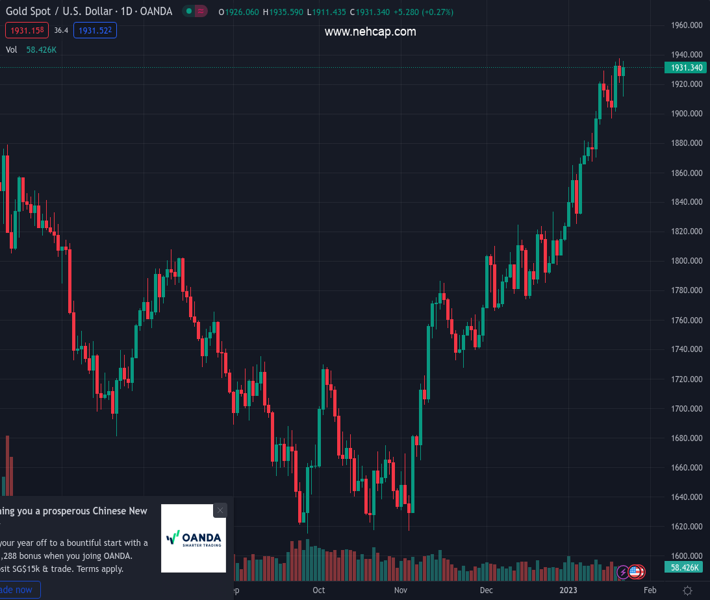
#XAUUSD @ 1,931.00 Gold price is looking for establishing the auction above $1,930.00 as the risk-on profile has strengthened. (Pivot Orderbook analysis)
…
This is a premium post.
[s2If !current_user_can(access_s2member_level4)]Please register for PREMIUM VERSION HERE to read full post below containing analysis. In case of any error or you think you are not able to read the full post below, please email us at support#nehcap.com [lwa][/s2If] [s2If current_user_can(access_s2member_level4)]
- Gold price is looking for establishing the auction above $1,930.00 as the risk-on profile has strengthened.
- US yields have scaled above 3.52% as the Fed policymakers have not toned down interest rate projections.
- The release of the US S&P PMI data will result in a power-pack action in the Gold price.
The pair currently trades last at 1931.00.
The previous day high was 1937.57 while the previous day low was 1920.71. The daily 38.2% Fib levels comes at 1927.15, expected to provide support. Similarly, the daily 61.8% fib level is at 1931.13, expected to provide resistance.
Gold price (XAU/USD) is looking to sustain above the immediate resistance of $1,930.00 in the early Tokyo session. The precious metal has extended its responsive buying action move from $1,912.50 to near $1,930.00 and is aiming to stretch further as the risk appetite of the market participants is firmer.
S&P500 ended Monday’s session with significant gains amid a decent quarterly result season. The US Dollar Index (DXY) dropped after failing to surpass the critical resistance of 101.80 despite multiple attempts. The 10-year US Treasury yields scaled above 3.52% as the Federal Reserve (Fed) policymakers have not trimmed their interest rate peak projections despite the presence of indicators that claim further decline in inflation projections.
Gold price is likely to display a power-pack action after the release of the preliminary United States S&P PMI data (Jan), which is scheduled for Tuesday. The Manufacturing PMI is seen lower at 46.1 while the Services PMI might contract to 44.5. Weaker demand projections and the unavailability of cheap money from the Fed due to higher interest rates might impact the US Dollar as fears of recession will soar further. This could also impact the strength of the S&P500.
Gold price is demonstrating signs of a loss in the upside momentum as the Relative Strength Index (RSI) is showing a negative bearish divergence formation. The Gold price is forming higher highs and higher lows while the momentum oscillator RSI (14) had formed a lower high when the asset formed a high of $1,937.57 on Friday, which indicates exhaustion in the bullish momentum.
The downside bias is not completely developed as the asset has not formed a lower low, which might be established on a breakdown of horizontal support plotted from January 18 low at $1,896.63.
The 20-period Exponential Moving Average (EMA) at $1,923.02 is still providing support to the Gold bulls.
Technical Levels: Supports and Resistances
XAUUSD currently trading at 1931.04 at the time of writing. Pair opened at 1927.24 and is trading with a change of 0.2 % .
| Overview | Overview.1 | |
|---|---|---|
| 0 | Today last price | 1931.04 |
| 1 | Today Daily Change | 3.80 |
| 2 | Today Daily Change % | 0.20 |
| 3 | Today daily open | 1927.24 |
The pair remains strongly bullish on the daily timeframe. It trades above its 20 SMA @ 1865.17, 50 SMA 1812.5, 100 SMA @ 1744.14 and 200 SMA @ 1775.96.
| Trends | Trends.1 | |
|---|---|---|
| 0 | Daily SMA20 | 1865.17 |
| 1 | Daily SMA50 | 1812.50 |
| 2 | Daily SMA100 | 1744.14 |
| 3 | Daily SMA200 | 1775.96 |
The previous day high was 1937.57 while the previous day low was 1920.71. The daily 38.2% Fib levels comes at 1927.15, expected to provide support. Similarly, the daily 61.8% fib level is at 1931.13, expected to provide resistance.
Note the levels of interest below:
- Pivot support is noted at 1919.44, 1911.65, 1902.58
- Pivot resistance is noted at 1936.3, 1945.37, 1953.16
| Levels | Levels.1 |
|---|---|
| Previous Daily High | 1937.57 |
| Previous Daily Low | 1920.71 |
| Previous Weekly High | 1937.57 |
| Previous Weekly Low | 1896.63 |
| Previous Monthly High | 1833.38 |
| Previous Monthly Low | 1765.89 |
| Daily Fibonacci 38.2% | 1927.15 |
| Daily Fibonacci 61.8% | 1931.13 |
| Daily Pivot Point S1 | 1919.44 |
| Daily Pivot Point S2 | 1911.65 |
| Daily Pivot Point S3 | 1902.58 |
| Daily Pivot Point R1 | 1936.30 |
| Daily Pivot Point R2 | 1945.37 |
| Daily Pivot Point R3 | 1953.16 |
[/s2If]
Join Our Telegram Group
")


